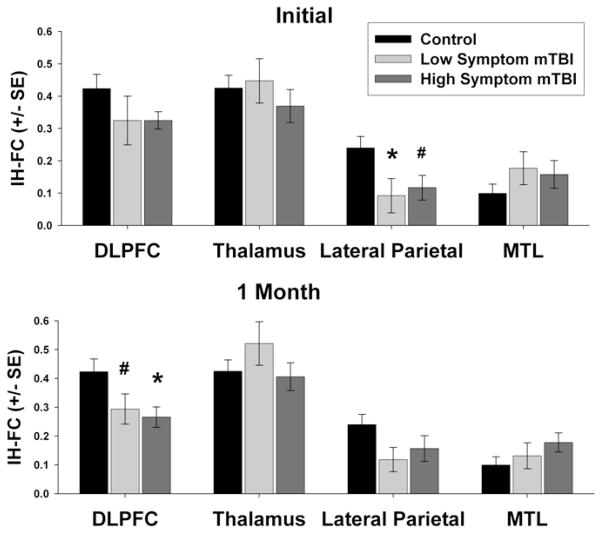
Figure 2.
ROI analysis of group differences in interhemispheric functional connectivity (IH-FC) within the dorsolateral prefrontal cortex (DLPFC), thalamus, lateral parietal lobe, and medial temporal lobe (MTL). (A) Initial stage (B) 1 month follow up. Significance assessed using separate One-Way ANCOVA accounting for differences in age between groups at each time point to assess group differences between control, high symptom mTBI, and low symptom mTBI. Fisher’s least significant difference (LSD) test was used to correct for multiple comparisons. # p <0.10, * p <0.05.

