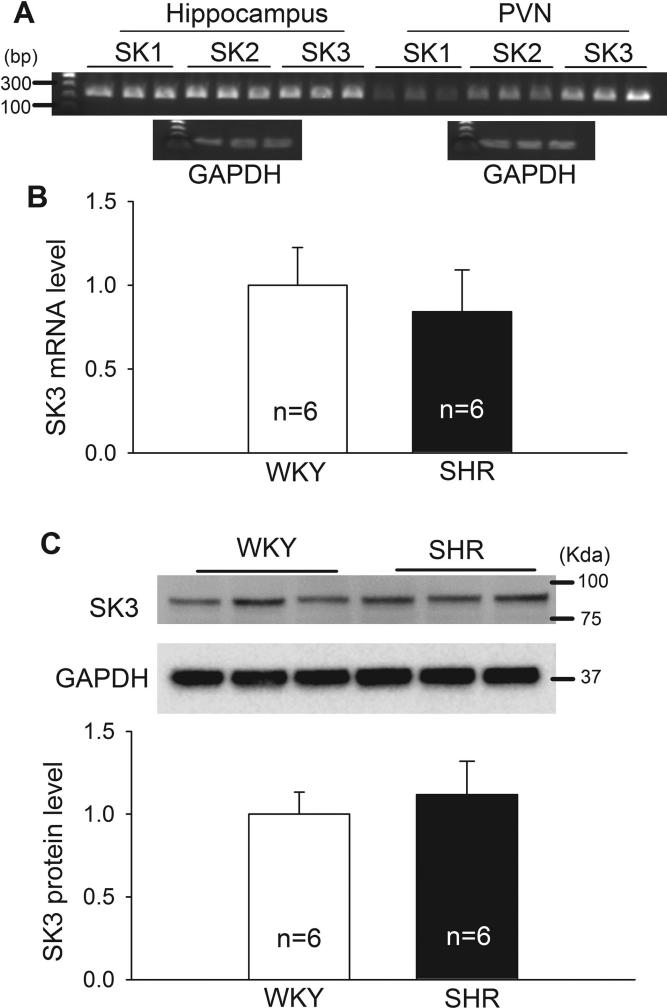
Figure 7. The expression level of SK3 in the PVN of WKY rats and SHRs.
A, Original agarose gel images show the expression of SK1, SK2, and SK3 channels in the hippocampus and PVN, analyzed by conventional PCR. PCR products (32 cycles) were loaded on 2% agarose gel containing ethidium bromide. GAPDH expression (27 PCR cycles) in both tissues was used as the control. B, Summary data show the mRNA level of SK3 channels in the PVN of WKY rats and SHRs, quantified by real-time PCR (n = 6 rats in each group). C, Original western blot gel images and quantification data show the protein levels of SK3 channels in the PVN of WKY rats and SHRs (n = 6 rats in each group). GAPDH was used as a loading control. Data are presented as means ± SEM.

