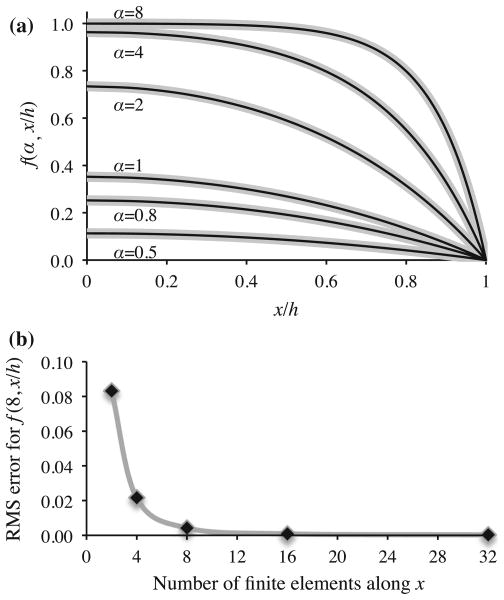
Fig. 2.
a Comparison of finite element results (thick gray curves) against analytical solution (thin black curves) for the cartilage matrix biosynthesis, binding and degradation study by DiMicco and Sah (2003). The function f (α, x/h) represents the normalized spatial distribution of the soluble matrix product concentration, where cu = kf f/kb, and bound matrix concentration, where cb = kf f/kd, over the range 0 ≤ x ≤ h, for different values of the non-dimensional parameter α (see text). b Mesh convergence results for α = 8

