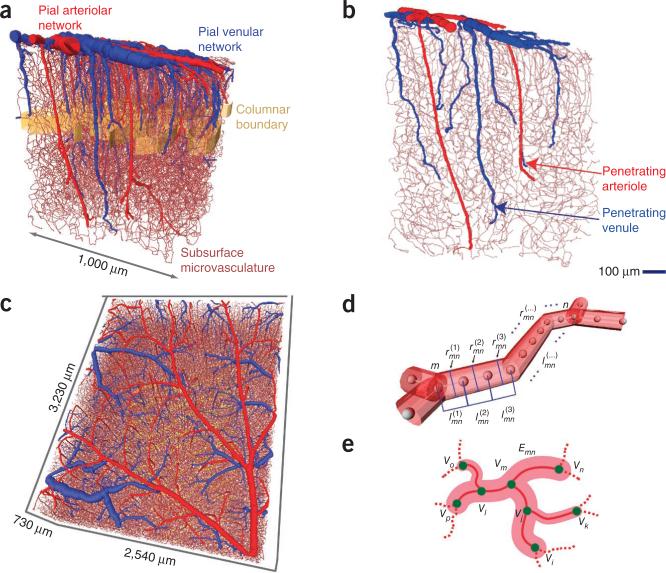
Figure 1.
Examples of the vectorized data sets. (a,b) Example of data obtained throughout the full depth of cortex and extending into the white matter. Surface and penetrating arterioles are colored red, venules blue and the borders of cortical columns are denoted by a golden band. A selected slice from this data set is shown to illustrate the extent of penetrating vessels (b). (c) Example of data obtained through the upper half of cortex from mice used for transcranial imaging of intrinsic optical signals; see Figure 6. (d) Schematic of the make-up of edges in terms of individual centerlines, each with length , where m and n label the vertices and k labels the consecutive centerlines between vertices, and radius , computed as the average between the measured radii at vertices m and n. (e) Schematic of labeling of edges (Enm) and vertices (Vm) used for topological analyses.

