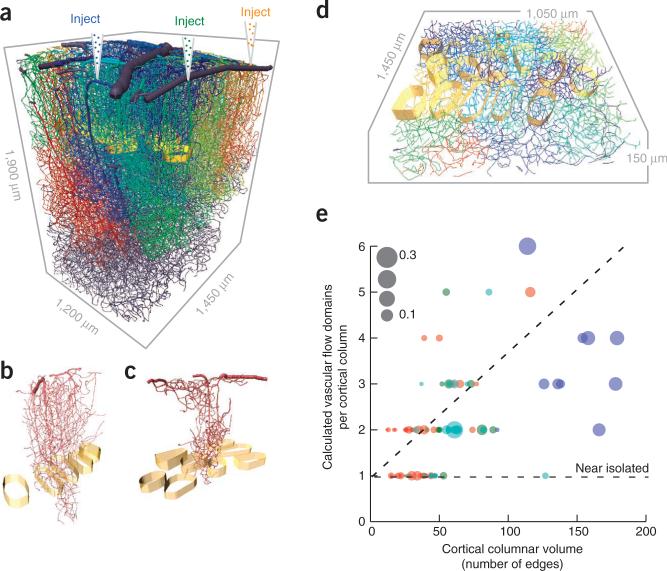
Figure 4.
Calculated fluid flow and domains of common input in complete vectorized networks. (a) Vectorized vasculature in which the blood flow through a given penetrating arteriole is numerically labeled to determine the vessels that receive at least half of their flow from the chosen penetrating arteriole. This exercise is repeated for all penetrating arterioles and each territory is labeled with a different color. (b,c) Examples of different flow domains relative the cortical columns. (d) Overlap of multiple flow domains with cortical columns in layer 4. (e) Scatter plot of the number of flow domains that are either encompassed or pass through a cortical column. The size of the dot is the fraction of the flow domain that has the largest overlap with a given cortical column. The horizontal line is the expected result when there is one domain per column and the dashed line is a linear fit to the data, with slope 0.028 ± 0.003 (mean ± 95% confidence interval).

