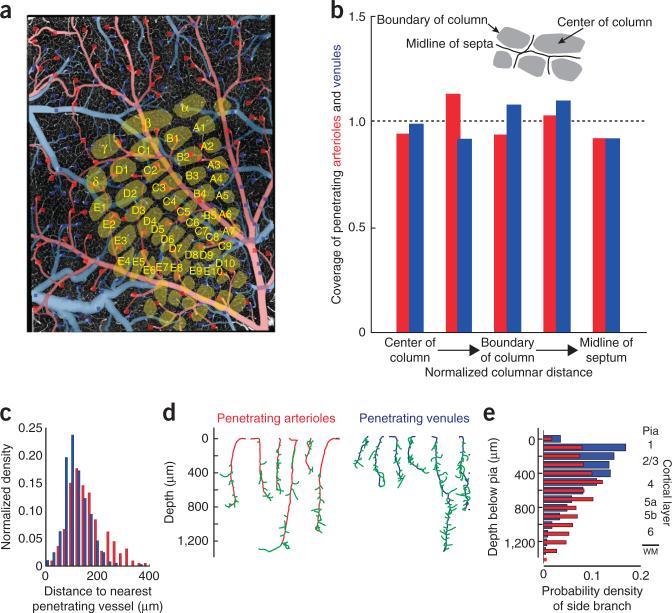
Figure 5.
Relation of penetrating vessels to cortical columns. (a) Example data set from a flattened cortex. The location of all penetration arterioles (red squares) and all penetrating venules (blue squares) are superimposed on an axial projection of the upper 150 μm of cortex. The cortical columns are based on imaging data taken with a flattened cortex. (b) Summary statistics on the location of penetrating vessels relative to the centroid of the cortical columns. The numbers of vessels in each bin, beginning at the center of the column and heading toward the midline of the septum (insert), were 15, 55, 47, 31 and 36 for the penetrating arterioles and 30, 84, 102, 63 and 68 for the penetrating venules. The locations of cortical columns boundaries were deduced from the cell density in layer 4. We plotted the fraction of pixels covered by arterioles or venues in each of five bins relative to the fraction expected for uniform coverage. (c) Probability density function for the distance between pairs of nearest penetrating arterioles (red) and between pairs of nearest venules (blue). The two distributions were significantly different (Kolmogorov-Smirnov test, P < 0.0001). (d) Examples of primary branches (green) from penetrating arterioles (red) and venules (blue). (e) Probability density function of the arteriole (red) and venule (blue) primary branches as a function of depth below the pia. The two distributions were significantly different (Kolmogorov-Smirnov test, P < 0.0001); the number of arteriole branches peaked near layer 4, whereas that for venules peaked at the surface.

