
Figure 2.
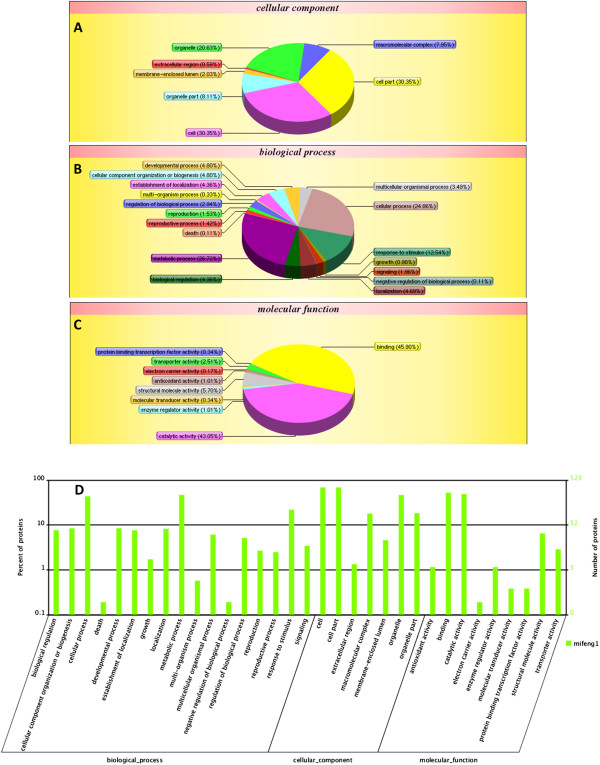
Classification of GO categories. The three functional categories were (A) cellular component, (B) biological process, and (C) molecular function. (D) WEGO output of our data. Hierarchical GO tree in which all the GO terms contained in the plot are shown to compare the annotation results. x-axis indicates functional items. y-axis (left) shows the percent of the proteins. y-axis (right) represents the number of proteins.