
Figure 5.
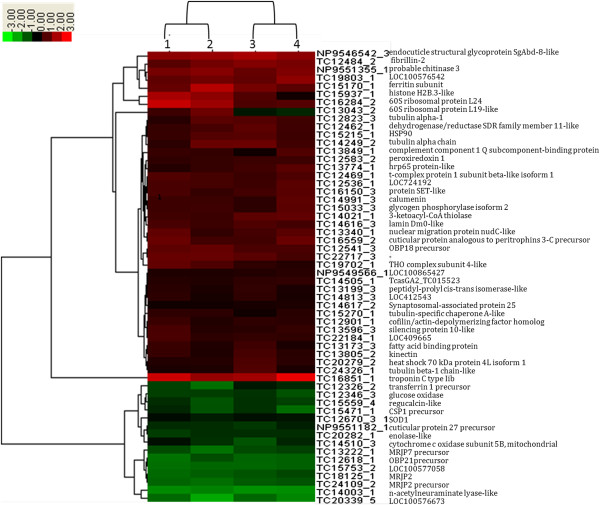
Hierarchical Clustering of multiple samples (56 proteins in all). Each column represents and compares a group relative to day 3, (1: d6 vs. d3; 2: d9 vs. d3; 3: d12 vs. d3; 4: d16 vs. d3) and each row represents a gene. Expression differences are shown in different colors; red indicates up-regulation, whereas green indicates down-regulation.