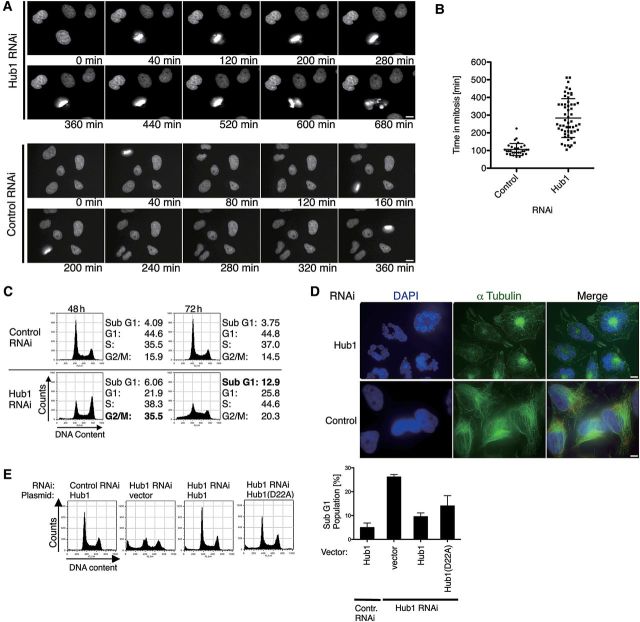
Figure 3.
Human Hub1 is essential for viability. (A) Live cell microscopy of H2B-GFP HeLa cells treated with RNAi against Hub1 or non-targeting control. The images represent stills of time-lapse video microscopy at representative time points 60 h post transfection. Scale bar, 10 µm. (B) Quantification of cell cycle delay after Hub1 knockdown by measuring time in mitosis from nuclear envelope breakdown until completion of mitosis by live cell microscopy of H2B-GFP HeLa cells. Data represent mean and standard deviation (SD) for control RNAi (n = 30) and Hub1 RNAi (n = 56). (C) Flow cytometry analysis of cell cycle distribution and induction of apoptosis after Hub1 depletion 48 or 72 h post transfection. Quantifications for the sub-G1 fractions are shown next to the flow cytometry profiles. (D) Representative images of HeLa cells 72 h after RNAi transfection exhibiting loss of nuclear integrity and structural abnormalities. In contrast to wild type or control RNAi-treated cells where nuclei were integer and regular in shape with a typical outspread α-tubulin network, Hub1 RNAi-treated cells exhibited deformed and disintegrated nuclei, segmented into multiple micronuclei that were radially arranged around central dense α-tubulin material. Immunofluorescence staining with anti-α-tubulin antibodies (green) and DAPI visualizes structural abnormalities and nuclear rearrangements. Scale bar, 10 µm. (E) Complementation of Hub1 RNAi by expression of siRNA-resistant Hub1 encoding WT or Hub1 D22A mutant. Analysis of cell cycle distribution and induction of apoptosis by flow cytometry with quantification of apoptotic sub-G1 fraction in Hub1 complementation assays (right panel, data represent mean and SD of three independent experiments). Due to highest knockdown efficiency Hub1 depletion and complementation experiments were performed using siRNA oligo iHub1_1.

