
Fig. 3.
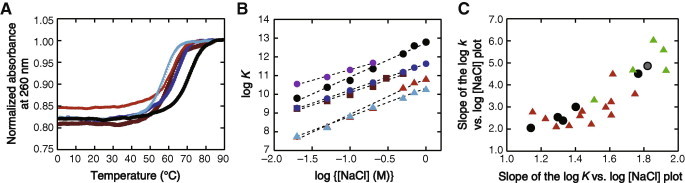
(A) Melting curves of the 11-mer RNA duplex in the 1 M NaCl solutions without (black) and with PEG200 (blue), EtOH (brown), FA (red), or DMF (cyan) at 20 wt%. (B) Plots of log K versus log [NaCl]. The data for PEG8000 (purple) at high NaCl concentrations were not available due to phase separation. The correlation coefficients of a linear fit are greater than 0.990. (C) Plots between the NaCl concentration dependence of log k and that of log K. The data using PEG and EG are indicated by black symbols, and those using the amide compounds and other compounds are indicated in green and red, respectively. The data using the solution without cosolutes are indicated in gray. (For interpretation of the references to color in this figure legend, the reader is referred to the web version of this article.)