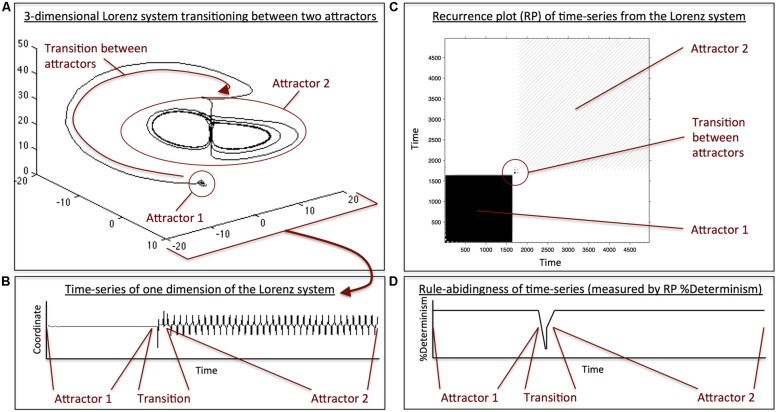
FIGURE 1.
(A) 3D illustration of a switching between two attractors (i.e., two quantitatively different types of behavior) in the Lorenz system, a coupled differential equation system consisting of three equations. When going through a phase-transition (i.e., moving from one attractor to another), the system does not show a smooth or instantaneous transition between the two attractor-states, but produces a transition period with major displacement. (B) Time-series of a single dimension of the Lorenz system that shows the behavior in the first attractor, the behavior in second attractor, and the transition phase. The behavior within each attractor looks very different, and the transition phase is marked by a period of increased fluctuation. (C) Recurrence plot (RP) of the time-series in (B). Recurrence plots are 2-dimensional representations of a time-series where time moves from the lower-left part of the plot to the upper-right part along the diagonal of the matrix. Dark areas in the plot indicate a high degree of temporal structure in the behavior of the time-series. White areas represent the absence of temporal structure in the time-series. The RP is similar to an autocorrelation plot, where time at lag0 runs along the diagonal. As one moves away from the diagonal toward the upper-left or lower-right part of the plot, one sees time-lagged behavior. Hence, the plot shows that the initial behavior (i.e., behavior in attractor 1) is highly structured, indicated by the dark area in the lower-left. Similarly, behavior in attractor 2 is highly structured, indicated by the striped area in the upper-right. However, the transition period between the two attractors is marked by a brief absence of structure. (D) Illustration of an RP-based measure of structuredness (%Determinism) of the time-series in (B). For both attractors, 1 and 2, the time-series possesses a high degree of temporal structure, but the transition between both attractors is marked by a loss of structure, indicated by the dip in %Determinism.

