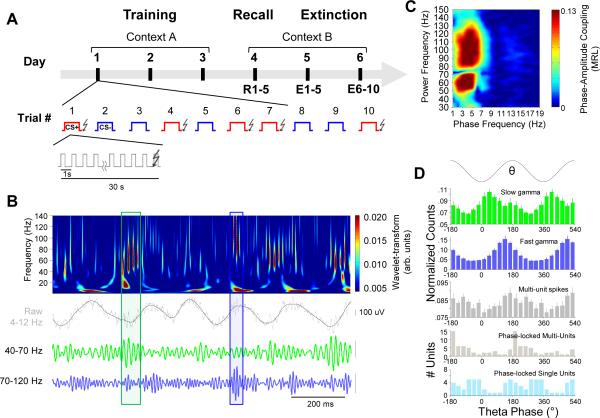
Figure 1. Two types of BLA gamma frequency oscillations are coupled to theta during fear recall.
(A) Experimental protocol. See text for detailed description.
(B) Wavelet transform (color plot) of BLA LFP (gray) recorded during recall session (Day 4). Lower traces, slow (40-70 Hz, green) and fast (70-120 Hz, blue) gamma events, occurring at distinct phases of the theta oscillation (black). Boxes indicate representative high-amplitude gamma events in each frequency band.
(C) Phase-Amplitude comodugram of a representative BLA LFP recording demonstrating modulation of high frequency power (y-axis) by low frequency oscillation phase (x-axis). Warm colors indicate stronger modulation; note the prominent modulation of separate slow (40-70 Hz) and fast (70-120 Hz) gamma peaks.
(D) Histograms for the occurrence of slow gamma troughs, fast gamma troughs and multi-unit spikes (top three panels) and the preferred phase of significantly phase-locked (p < .05, Rayleigh test) multi-units (n=48) and single units (n=38; bottom two panels) relative to phases of the theta (4-12 Hz) oscillation. Error bars, here and throughout, are +/− SEM, except as otherwise noted.

