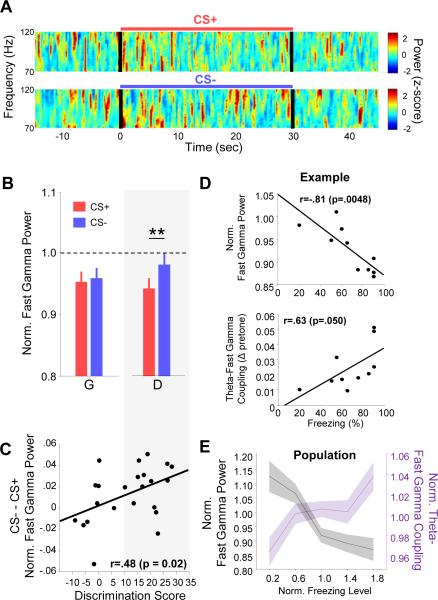
Figure 3. BLA fast gamma power decreases during conditioned fear.
(A) Example multi-taper spectrograms of BLA LFP during a CS+ (top) and CS− (bottom) presentation. Power was normalized by z-scoring in each frequency range. Black lines, stimulus onset and offset.
(B) Fast gamma power during CS+ (red) and CS− (blue) presentations for Discriminators (D) and Generalizers (G). ** p <.01, sign-rank.
(C) The difference between CS− and CS+ fast gamma power plotted by animal, as a function of discrimination score (CS+ - CS− percent freezing), with Pearson's r and p-value indicated. Grey box spanning panels (B) and (C) indicates data from the discriminator group.
(D) Fast gamma power (top) and theta-fast gamma coupling strength (bottom) as a function of freezing on a trial-by-trial basis for an example animal. Each symbol represents data from a single trial. Data are normalized to pretone values.
(E) Population data showing fast gamma power (black) and theta-fast gamma coupling (purple) as a function of freezing level (p<.001 and p<.05, respectively, MLR). All data is mean-normalized.

