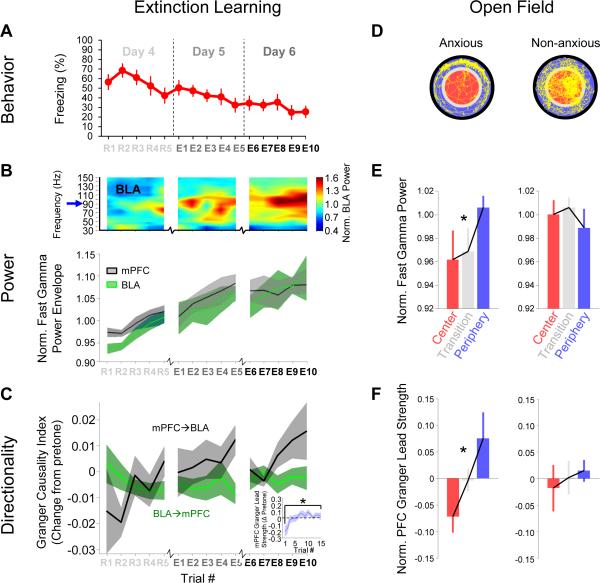
Figure 8. mPFC lead and BLA fast gamma power in extinction and the open field.
(A) Freezing values for mice undergoing extinction during extinction training (CS+ data only).
(B) Top, power spectrogram of BLA LFP from a representative animal, showing trial to trial changes in fast gamma power through extinction. Bottom, population mean +/− SEM fast gamma amplitude through extinction for BLA (green) and mPFC (gray).
(C) Mean +/− Granger causality index, normalized by pretone value, for mPFC→BLA (gray) and BLA→mPFC (green) directions as a function of trial number. GCImPFC→BLA significantly increased throughout extinction (p=4.7 × 10⁻⁵, MLR), without a corresponding change in the GCIBLA →mPFC (p=.97). Inset, relative mPFC granger lead strength (see text) from R1 to E10.
(D) Representative paths (yellow) of an anxious (left) and a non-anxious (right) mouse during exploration of a novel open field. Data from center (red), periphery (blue), and transition (gray) epochs was analyzed separately.
(E) Fast gamma power by open field zone for anxious (n=9, left) and non-anxious (n=6, right) mice.
(F) mPFC Granger lead strength by open field zone for anxious (left) and non-anxious (right) mice.

