
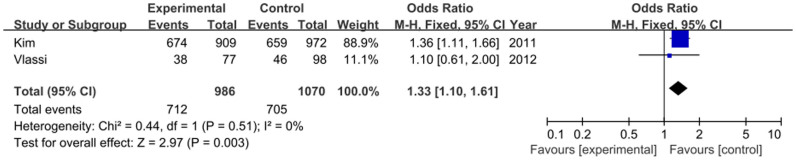
Figure 5. Forest plot on the association for the dominant model (TT+TC vs. CC) of MTNR1B rs1387153 and GDM in a fixed-effects model.
Official websites use .gov
A
.gov website belongs to an official
government organization in the United States.
Secure .gov websites use HTTPS
A lock (
) or https:// means you've safely
connected to the .gov website. Share sensitive
information only on official, secure websites.