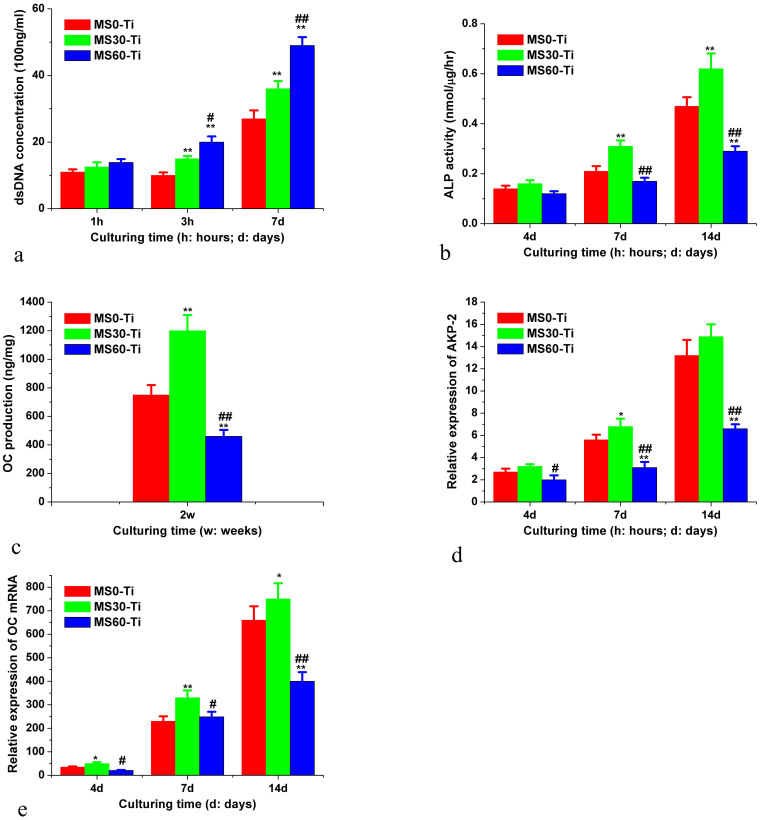
Figure 5. Osteogenic activities of various surfaces.
(a) Cell attachment and proliferation; (b) ALP activity; (c) OC production; (d) AKP-2 mRNA expression; and (e) OC mRNA expression. Data represent mean ± standard deviation (n = 3) with statistical difference (*, #, p < 0.05; **, ##, p < 0.01). The symbol * represents samples in the other groups versus that in the MS0-Ti group; symbol # represents samples in other groups versus that in MS30-Ti group.

