
Figure 3.
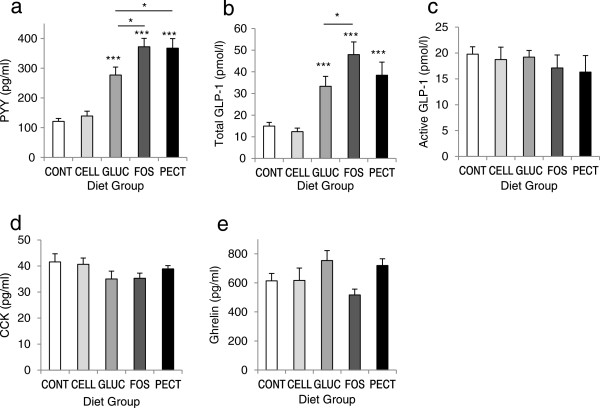
Plasma hormone concentrations. Plasma concentrations of (a) PYY, (b) total GLP-1, (c) active GLP-1, (d) CCK and (e) ghrelin in rats given diets containing different dietary fibres for 4 weeks. Diets contained 5% w/w cellulose (CONT) or 10% w/w fibre as cellulose (CELL), oat beta-glucan (GLUC), fructo-oligosaccharide (FOS) or apple pectin (PECT). Values are means ± s.e.m. (n = 10/group). Significant differences were detected by one-way ANOVA. *P < 0.05, ***P < 0.001 vs CONT, unless indicated.