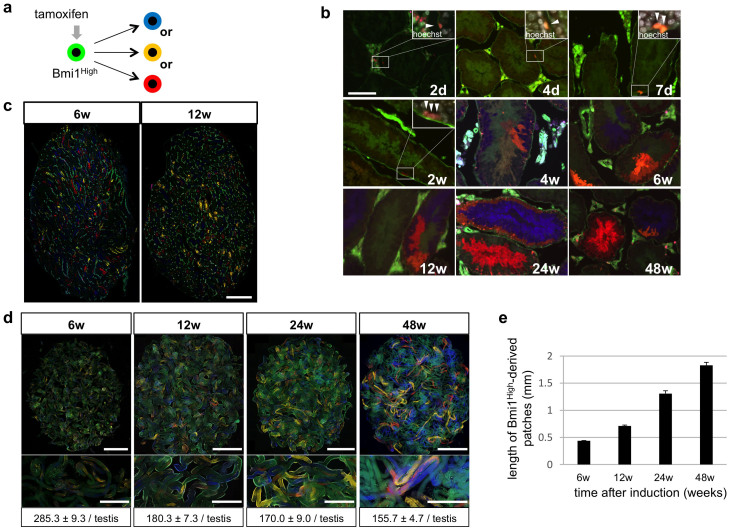
Figure 1. Detection of Bmi1High-positive cells in seminiferous tubules and their lineage tracing.
(a) Cre-mediated fluorescent color change in Bmi1creER/+/Rosa26Rbw/+ mice. Fluorescent colors of Bmi1High-positive cells change from green to one of the three colors (red-, orange- or blue-color) by Cre-mediated excision of floxed cassettes induced by tamoxifen and their descendant cells retain the changed color. (b) Existence of Bmi1High-derived cells in the area of GSCs in the inner periphery of seminiferous tubules and their expansion. Bmi1creER/+/Rosa26Rbw/+ mice were injected with tamoxifen and Bmi1High-positive stem cell-derived cell clusters were analyzed at indicated time points. White windows at the right upper corner; magnified pictures of indicated rectangle areas. Merged images with Hoechst 33342 counter staining (white) are shown. White arrowheads indicate Bmi1High-derived cells. (c) Sections of the testes from Bmi1creER/+/Rosa26Rbw/+ mice at indicated time points after tamoxifen administration. Multiple single color areas derived from Bmi1High-positive cells are observed. (d) Numbers of patches observed at indicated time points in the testes from Bmi1creER/+/Rosa26Rbw/+ mice injected with tamoxifen. Upper panels; fluorescent images of untangled seminiferous tubules from one testis. Middle panels; magnified pictures of seminiferous tubules. Lower panels; number of patches at indicated time points after tamoxifen induction (n = 3). (e) Length of patches observed at indicated time points in the testes from Bmi1creER/+/Rosa26Rbw/+ mice injected with tamoxifen. Scale bars = 100 μm in (b), 1 mm in (c), 5 mm in (upper panel of d), 2 mm in (middle panel of d).

