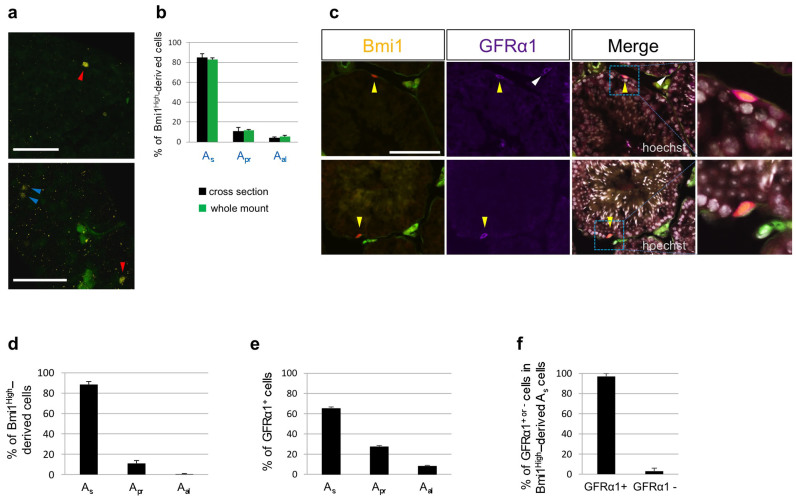
Figure 2. Relationship between Bmi1High-derived cells and GFRα1-positive cells analyzed by immunohistochemistry.
(a) The images of whole-mount seminiferous tubules from Bmi1creER/+/Rosa26Rbw/+ mice that received tamoxifen 2 days before. A red arrowhead; Bmi1High-derived Asingle cells, A blue arrowhead; Bmi1High-derived Apaired cells. Scale bars = 100 μm. (b) Frequency of Bmi1High-derived cells in Asingle, Apaired, and Aaligned cell populations obtained from Bmi1creER/+/Rosa26Rbw/+ mice that received tamoxifen 2 days before. Bmi1High-derived cells were detected by whole-mount method or serial cross-section method. (c) Anti-GFRα1 antibody-immunostaining of cross-sections of seminiferous tubules from Bmi1creER/+/Rosa26Rbw/+ mice received tamoxifen 2 days before. Yellow arrowheads: Bmi1High (orange)-derived and GFRα1 (purple)-positive cells. White arrowheads: Bmi1-negative and GFRα1 (purple)-positive cells. Right panels of merged images: magnified pictures of indicated rectangle areas. Merged images with Hoechst 33342 counter staining (white) are shown. Scale bar = 100 μm. (d) Frequency of Bmi1High-derived cells in Asingle, Apaired, and Aaligned cell populations (n = 271 from 4 testes). (e) Frequency of GFRα1-positive cells in Asingle, Apaired, and Aaligned cell populations (n = 533 from 3 testes). (f) Frequency of GFRα1-positive or negative cells in Bmi1High-derived Asingle cells (n = 73 from 3 testes).

