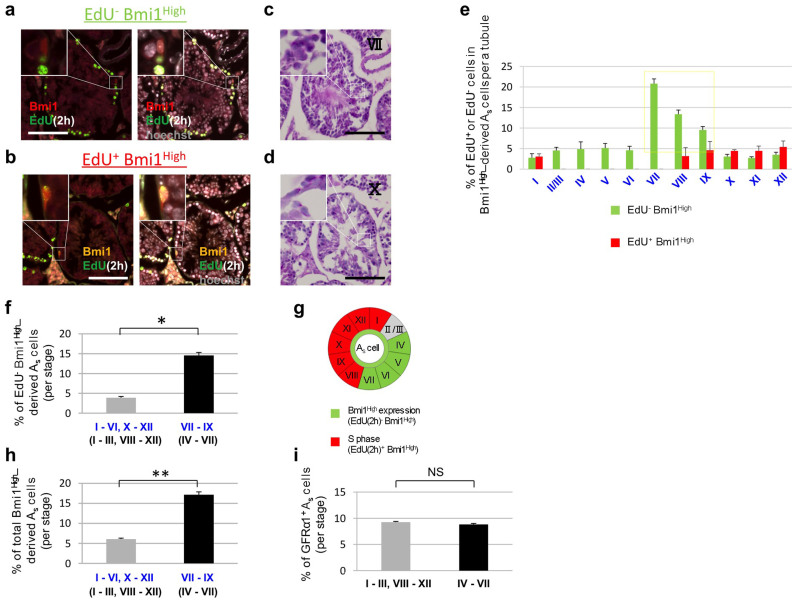
Figure 5. Relationships between proliferative states and seminiferous stages in Bmi1High-derived Asingle cells.
(a-d) Fluorescent microscopic analyses and PAS-hematoxylin staining of cross-sections of seminiferous tubes obtained from Bmi1creER/+/Rosa26Rbw/+ mice. Tamoxifen was injected into Bmi1creER/+/Rosa26Rbw/+ mice. EdU was administrated to the mice 2 days later. Their testes were removed 2 hours later and serial cross-sections were prepared. (a and b) Detection of Bmi1High-derived cells and EdU-positive proliferating cells. White windows at the left upper corner; magnified pictures of indicated rectangle areas. Right panels; Merged images with Hoechst 33342 counter staining (white) are shown. PAS-hematoxylin staining of serial sections (c and d were adjacent sections of a and b, respectively). White windows at the left upper corner; magnified pictures of indicated rectangle areas. (e) Relationship among Bmi1High expression, proliferation of Asingle cells, and the seminiferous epithelial stages. Green bars; EdU-negative Bmi1High-derived Asingle cells (including resting cells), red bars; EdU-positive Bmi1High-derived Asingle cells (proliferating cells). Please note that these Bmi1High-derived cells in our system are observed 2 days after tamoxifen induction, therefore 2 days delay should be taken into consideration when judging stages. Therefore, actual stages when these EdU-negative Bmi1High-derived Asingle cells increase should be in stage IV-VII (see Text). The percentages of EdU-positive (red bar) or -negative (green bar) Bmi1High-derived Asingle cells per a seminiferous tubule in total Bmi1High-derived Asingle cells are shown. The increase of EdU-negative Bmi1High-derived Asingle cells (indicated by a yellow square) precedes the increase of EdU-positive Bmi1High-derived Asingle cells. (f) EdU-negative Bmi1High-derived Asingle cells significantly increase in stage VII-IX (actual stages: IV-VII). *P < 0.0001 by unpaired Student's t-test. (g) Schematic presentation of the result of (e) and (f). (h) Total Bmi1High-derived Asingle cells (EdU-negative and -positive) significantly increase in stage VII-IX (actual stages: IV-VII). **P < 0.001 by unpaired Student's t-test. (i) GFRα1-positive Asingle cells do not increase in stage IV-VII. NS: not significant by unpaired Student's t-test. As: Asingle Delayed stages are indicated by blue Roman numbers (e, f and h) and actual stages are indicated by black Roman numbers (c, d and f-i). Scale bars = 100 μm.

