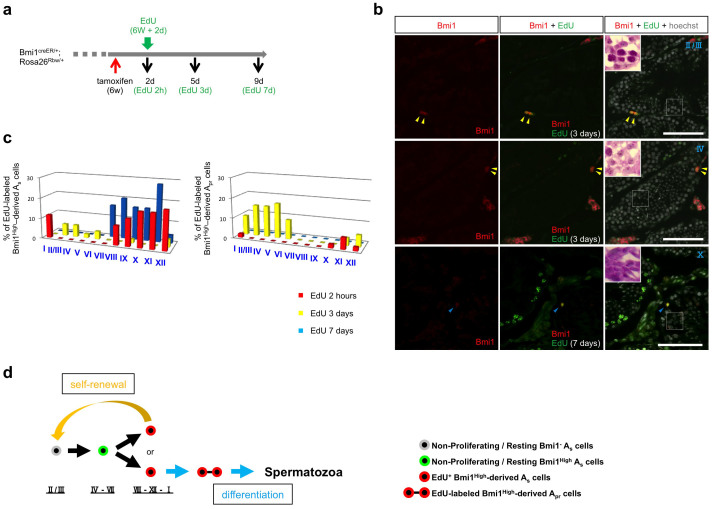
Figure 7. Lineage tracing of EdU-labeled Bmi1High-derived cells and Asingle cell kinetic model.
(a) Experimental protocol of EdU and tamoxifen administration to Bmi1creER/+/Rosa26Rbw/+ mice. A red arrow; tamoxifen administration. A green arrow; EdU administration. Black arrows; timing of analyses of the testes. The black numbers indicate the days after tamoxifen administration. The green numbers show the days after EdU administration. d; days. h; hours. w; weeks. (b) The fate of EdU-labeled Bmi1High-derived Asingle cells. Bmi1High-derived (left) and EdU-labeled Bmi1High-derived (middle) cells at indicated time points. Right panels; Merged images with Hoechst 33342 counter staining (white) are shown. White windows (right panels) at the left upper corner; the magnified images of adjacent sections stained by PAS-hematoxylin staining corresponding to rectangle areas. Roman numbers indicate the seminiferous epithelial stage. Scale bar = 100 μm. Yellow arrowheads; EdU-labeled Bmi1High-derived Apaired cells. Blue arrowheads; EdU-labeled Bmi1High-derived Asingle cells. (c) Time course of EdU-labeled Bmi1High-derived Asingle, or Apaired cells. Left: % of EdU-labeled Bmi1High-derived Asingle cells to the whole EdU-labeled Bmi1High-derived cells were blotted. Right: % of EdU-labeled Bmi1High-derived Apaired cells to the whole EdU-labeled Bmi1High-derived cells were blotted. Red: 2 hours after EdU administration (n = 52) Yellow: 3 days after EdU administration (n = 52) Blue: 7 days after EdU administration (n = 25) (d) A schematic model illustrating the relationship of Bmi1High expression, cell cycle phase and seminiferous epithelial stages during early spermatogenesis.

