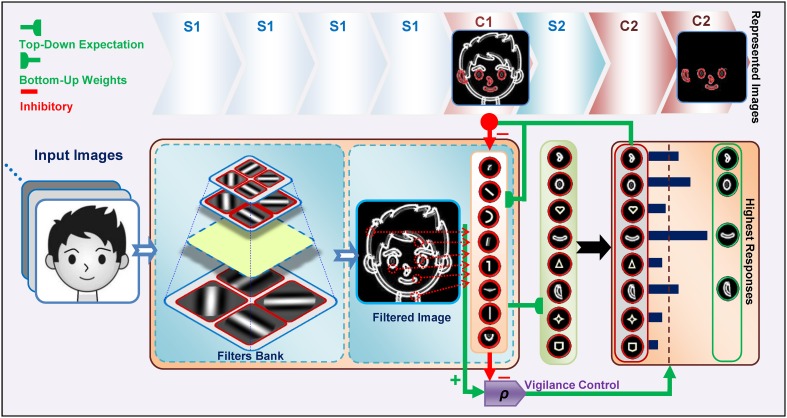
Figure 1.
The structure of the Stable model. Gray scale images are applied to the model and the outputs of S1 and then C1 are attained. Then, the S2 responses are computed using existing prototypes. To compute the C2 responses, the S2 units with the maximum response for each prototype are selected. The highest active C2 units are then selected as prototypes to represent the image (see green box at right, specified by “Highest Responses”). This selection is achieved by top-down expectations, which match the input image to the prototypes. A lateral subsystem (vigilance control), which uses a vigilance parameter (ρ), determines the matching degree between the prototypes and various parts of the input image.

