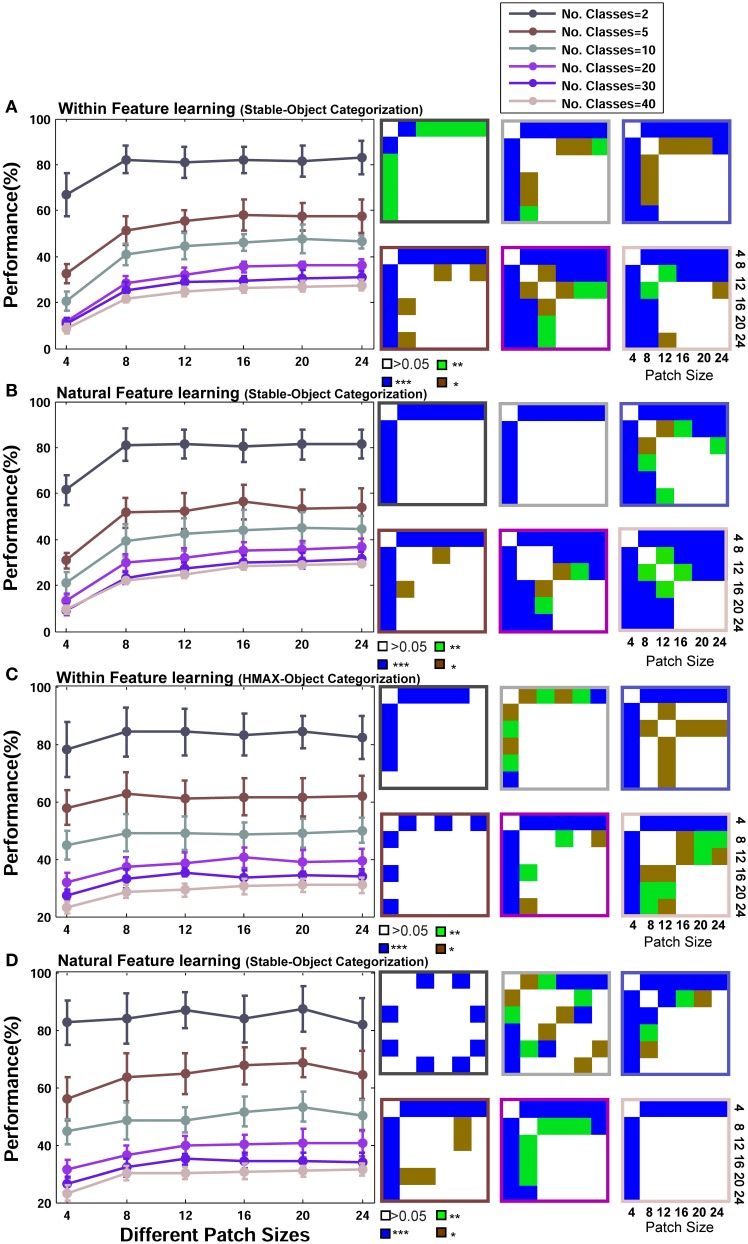
Figure 9.
Performance comparisons between different patch sizes and feature learning strategies in object recognition task. (A) Performance comparison between different patch sizes for the Stable model when uses natural images in feature learning phase. Each curve shows the result of different number of classes that vary from 2 to 40 (specified with different colors). The results are the average of 30 random runs and error bars are standard deviation. Right insets, next to each plot, demonstrate p-values for all possible comparisons within each experiment. The color code shows the significance level and the color of frames corresponds to related curves (number of classes). Each symbol shows a p-value: “*” for p < 0.05, “**” for p < 0.01, and “***” for p < 0.001. (B) Performance comparison when Stable model selects within category feature learning strategy. (C) Performance of the HMAX model for different patch sizes when features are learned from a large set of natural images. (D) Performance comparison when the HMAX model selects within category feature learning strategy.

