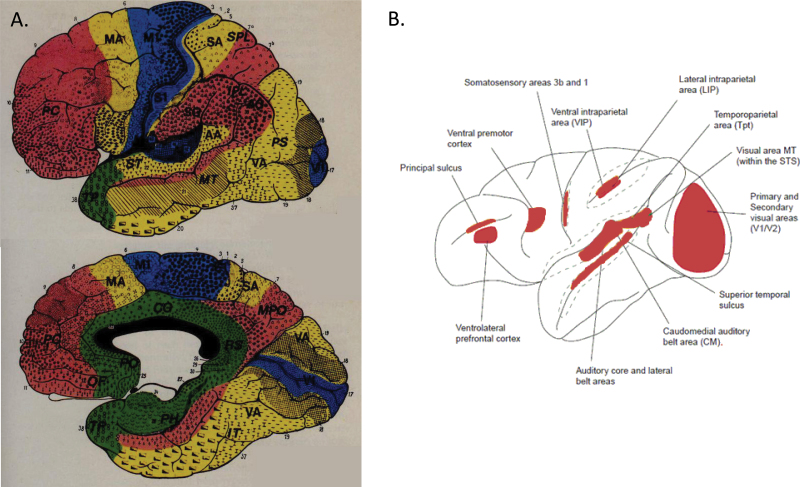
Fig. 1.
Hierarchical cortical organization. (A) Figure adapted from Mesulam.13 A schematic of cortical organization showing primary sensory/motor cortex (blue), unimodal cortex (yellow), and heteromodal (multimodal—red) superimposed on a map of Brodmann areas. (B) Figure adapted from Ghazanfar.15 Areas exhibiting cross-sensory interactions are shown in red, superimposed on a schematic of the nonhuman primate brain. The map is similar to that shown in (A) with the addition of primary sensory areas.

