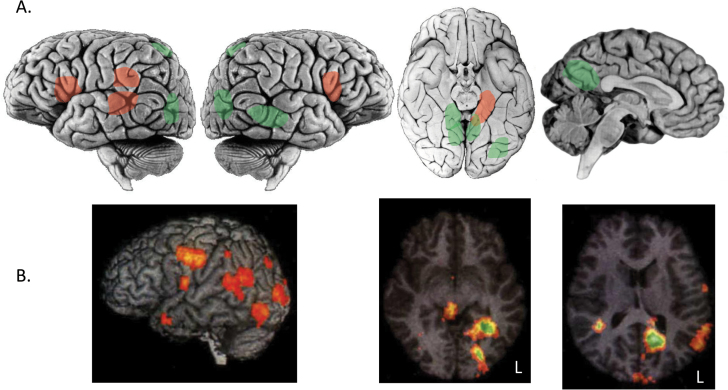
Fig. 4.
Hallucination network in schizophrenia. (A) Summary of activation during auditory verbal hallucinations (red) or visual hallucinations (green) reported in previous studies39,56 from lateral, ventral and medial views of the brain (insula and basal ganglia not shown). (B) Activation during multimodality hallucinations (visual and voice content) adapted from.61 Activity is shown in lateral view (left panel) and axial slices at Talairch z = −7 (middle panel) and z = +13 (right panel).

