Figure 1.

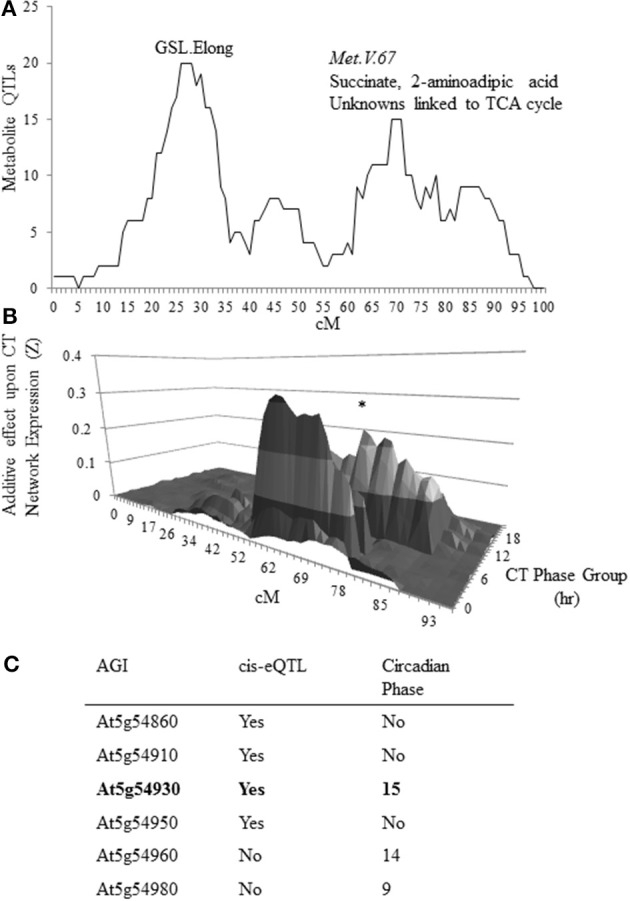
Candidate identification for metabolomics QTL MET.V.67. (A) The number of metabolites for which a QTL was detected in the Bay × Sha RIL population on chromosome V within a 10 cM sliding window is shown. The permuted threshold (P = 0.05) for detection of a significant metabolite hotspot within this analysis is 12 metabolite QTLs. The X axis shows the chromosomal position in cM. The known metabolomics QTLs on chromosome V are labeled as GSL.Elong and Met.V.67 with the known chemicals listed above the peak. (B) Shown is the impact of natural variation on chromosome V in the Bay × Sha RIL population upon expression of circadian CT phase group networks from previously published data. Each CT phase group consists of the genes that have a peak of circadian expression within 30 min of the time for that group. The graph presents the predicted additive effects across chromosome V for each CT phase group's expression from CT0 to CT23. The asterisk marks the CT phase group that is most impacted at the Met.V.67 locus (CT15).The bottom shows the position on the chromosome in cM. (C) Shown is the list of candidate genes in the 3-LOD interval for the metabolomics QTL Met.V.67 (At5g54830 to At5g55040) that have either a cis-eQTL or are regulated in a circadian manner with the phase reported.
