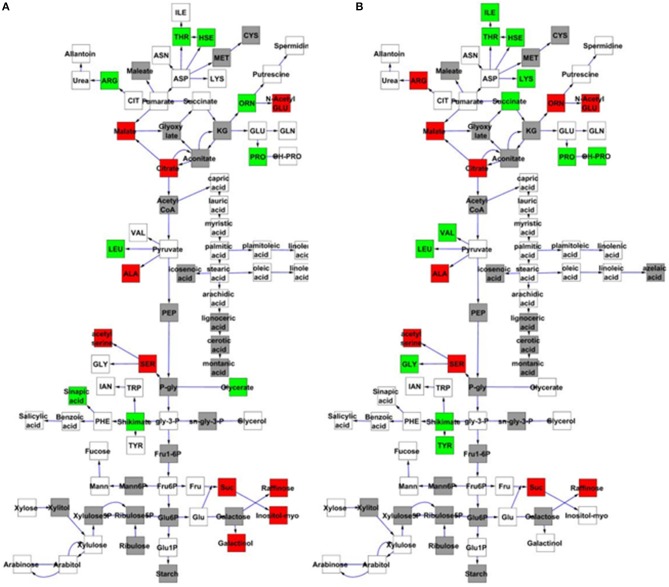
Figure 4.
MNM1 effects upon the metabolic network. Shown are the known primary metabolites that are altered at all timepoints by the mnm1-1 and mnm1-2 and overexpression genotypes in comparison to wildtype controls within the free-run experiment. The gray boxes show metabolites not measured in these experiments, white boxes are metabolites that had no significant difference, green boxes were up regulated in the respective MNM1 genotypes and red boxes were down-regulated in the respective MNM1 genotypes. Only metabolites showing a significant effect across the mnm1-1 and mnm1-2 and OE genotypes are presented. The central metabolites are presented in a stylized representation of central metabolism with common abbreviations for each chemical. Arrows represent enzymatic linkages between detected compounds but are not necessarily showing single enzymatic steps. All detected intermediates such as shikimate are included in the network. (A) Metabolites altered in both the mnm1-1 and mnm1-2 genotypes. (B) Metabolites altered in both MNM1 OE genotypes.

