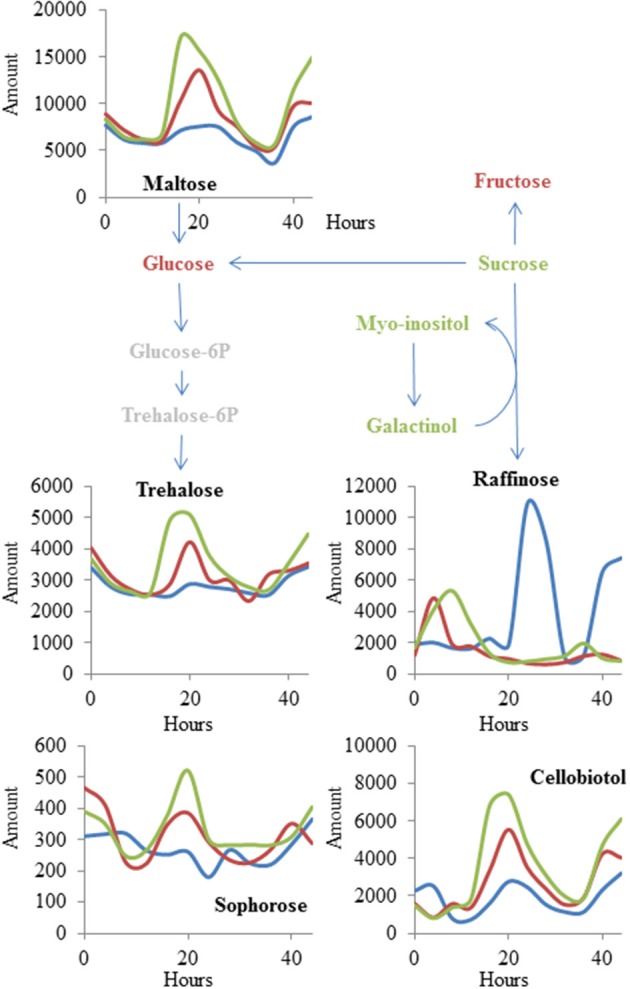
Figure 5.

MNM1 effects upon cycling within the metabolic network. Shown are the known metabolites that were altered in a time-dependent fashion by the mnm1-1, mnm1-2, and MNM1 OE genotypes in comparison to wildtype controls within the free-run experiment. The metabolites are placed within a sugar network for illustration. Red metabolites had no significant effect of MNM1 function, green metabolites had a significant effect of MNM1 function but no interaction with time and are shown in Figure 4. Metabolites labeled in black had a significant interaction of MNM1 function and time within the analysis. Their levels are shown across the 44 h of the experiment in relative abundance levels obtained from the GC-TOF analysis. Blue lines in the graph represent WT Col-0, Red lines are the effect of mnm1-1 and mnm1-2, while green is the effect of the OE7 and OE8 genotypes.
