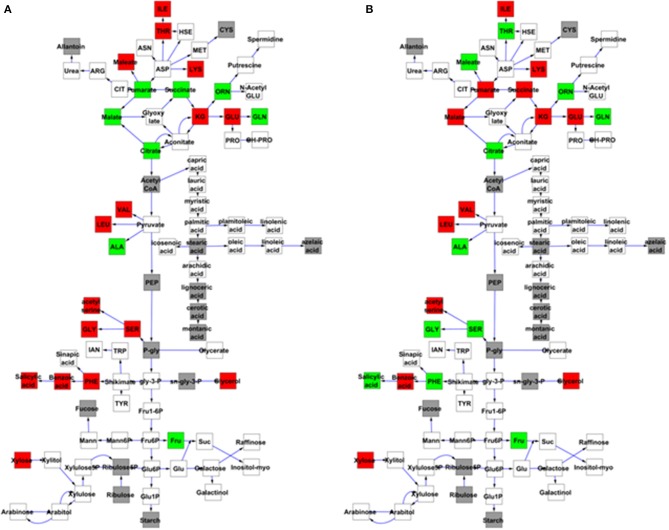
Figure 6.
Quantitative complementation to validate MNM1 as the Met.V.67 QTL. Full genomic Bay or Sha alleles of MNM1 were transgenically reintroduced into both the mnm1-1 and mnm1-2 background genotypes. Homozygous T2 lines were analyzed for metabolomics at either 4 or 24 h in a free-run experiment as identified as key timepoints for MNM1 function. The 4 h timepoint is the same that was sampled to identify the Met.V.67 QTL. The effect on only central metabolites showing a significant difference between the Bay and Sha allele when introduced into both the mnm1-1/2 genotypes presented at the specific timepoint shown. The gray boxes show metabolites not measured in these experiments, white boxes are metabolites that had no significant difference, green boxes are metabolites higher in Bay allele complementation lines and red boxes are metabolites higher in the Sha allele complementation lines. The metabolites in central metabolism are presented in a stylized representation of central metabolism with common abbreviations for each chemical. Arrows represent enzymatic linkages between detected compounds but are not necessarily showing single enzymatic steps. All detected intermediates such as shikimate are included in the network. (A) Metabolites that significantly differ between the Bay and Sha MNM1 alleles at the 4 h timepoint. (B) Metabolites that significantly differ between the Bay and Sha MNM1 alelles at the 24 h timepoint in constant light.

