
Fig. 4.
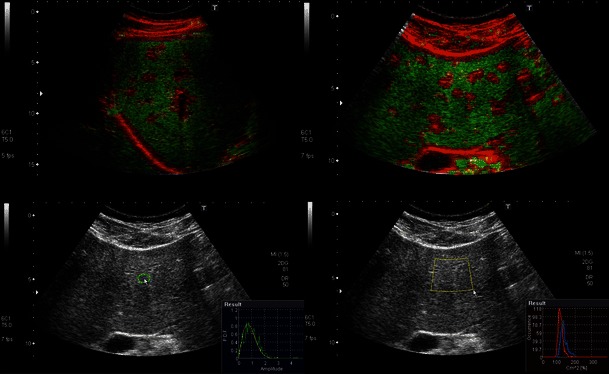
Speckle pattern analysis with acoustic structure quantification (ASQ). Upper images: Homogeneous normal liver parenchyma is displayed as green whereas portal tracts and other structures with different and heterogeneous structure are highlighted in red. Lower images: Example of quantitative tools showing the probability density function (green curve) and theoretical speckle generated by Rayleigh distribution (red)