
Fig. 2.
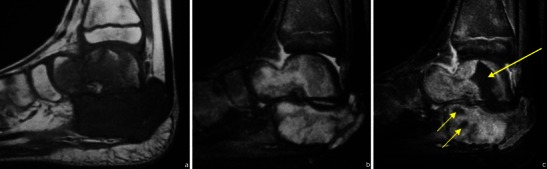
T1WI (a), T2FS WI (b) and CEMRI (c) images of a Ewing’s sarcoma involving the talus and calcaneus. Non-enhancing components (arrows in c) are related to areas of necrosis
Official websites use .gov
A
.gov website belongs to an official
government organization in the United States.
Secure .gov websites use HTTPS
A lock (
) or https:// means you've safely
connected to the .gov website. Share sensitive
information only on official, secure websites.
T1WI (a), T2FS WI (b) and CEMRI (c) images of a Ewing’s sarcoma involving the talus and calcaneus. Non-enhancing components (arrows in c) are related to areas of necrosis