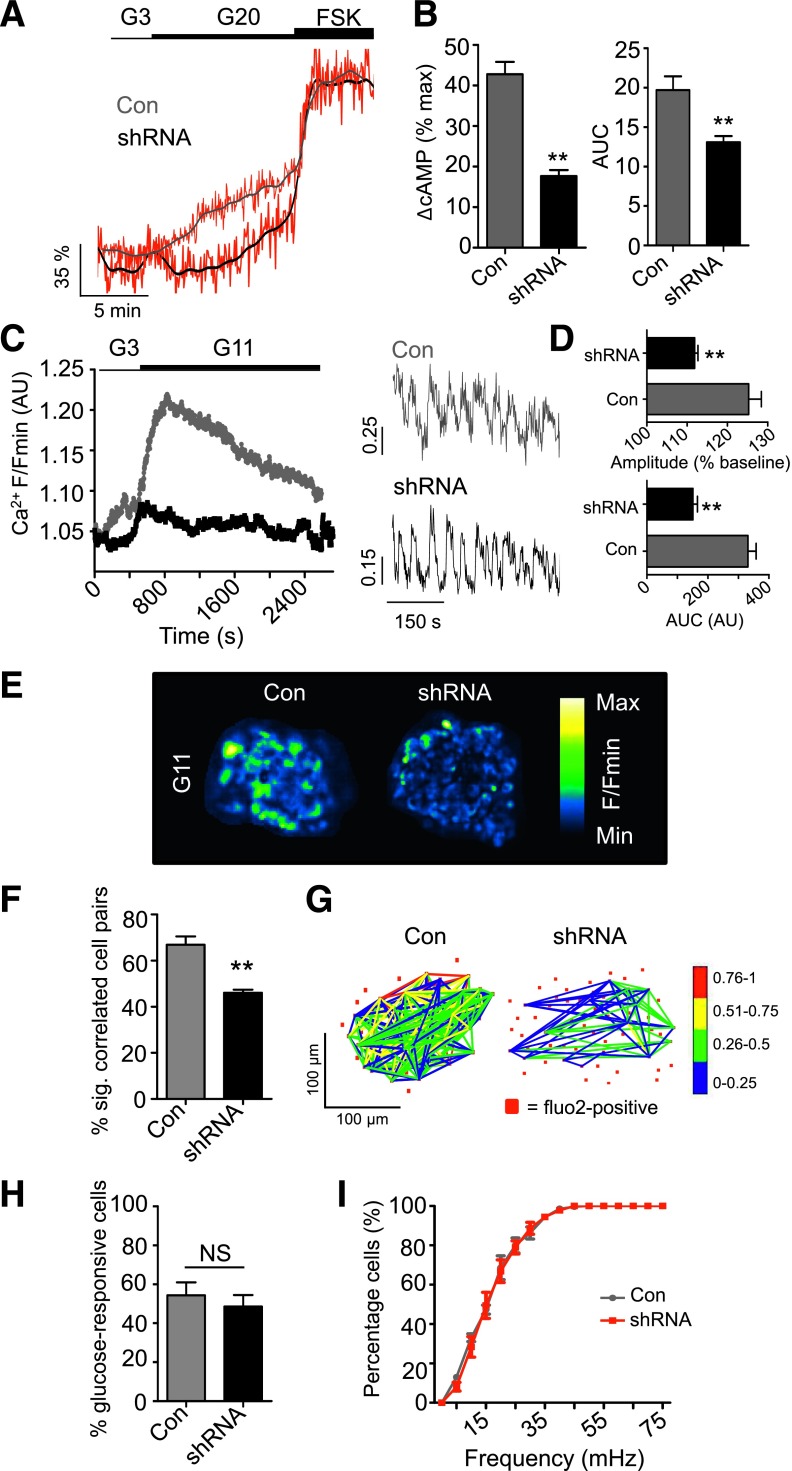
Figure 3.
ADCY5 depletion suppresses glucose-induced increases in cytosolic free Ca2+. A: ADCY5 silencing decreases cystosolic cAMP levels, as determined using the recombinant probe Epac2-camps (representative traces shown; gray/black, smoothed; red, raw). B: As for A, but summary data showing a reduction in measured FRET signal versus maximal stimulation with FSK (%), as well as decreased AUC (**P < 0.01 vs. Con; Student t test; n = 12 recordings from three donors). C: ADCY5 knockdown suppresses 11 mmol/L glucose (G11)-evoked cytosolic Ca2+ rises (left panel: mean traces) (right panel: zoom-in of Ca2+ oscillations). D: AUC and amplitude of Ca2+ rises are reduced in shRNA-treated islets (right panel, **P < 0.01 vs. Con; Mann-Whitney U test; n = 10 islets from three donors). E: Pseudocolored Con and shRNA-treated human islets during exposure to 11 mmol/L glucose (recording time = 40 min; image cropped to display a single islet). F: ADCY5 is required for long-term evolutions in coordinated cell activity after exposure to elevated glucose (**P < 0.01 vs. Con; Mann-Whitney U test; n = 9–10 islets from three donors) (correlation calculated over 20–30 min; sig, significantly). G: Representative functional connectivity map depicting location, number, and strength (color-coded; 0 [blue] = lowest, 1 [red] = highest) of significantly correlated cell pairs (Pearson R coefficient, P < 0.05). Note that ADCY5 silencing decreases both the number and strength of correlations. H: Gene silencing does not significantly alter the percentage (%) of glucose (11 mmol/L)-responsive cells (NS, nonsignificant vs. Con; Mann-Whitney U test). I: The cumulative distribution of Ca2+-spiking frequencies remains similar in Con and shRNA-treated islets. Values represent mean ± SEM.

