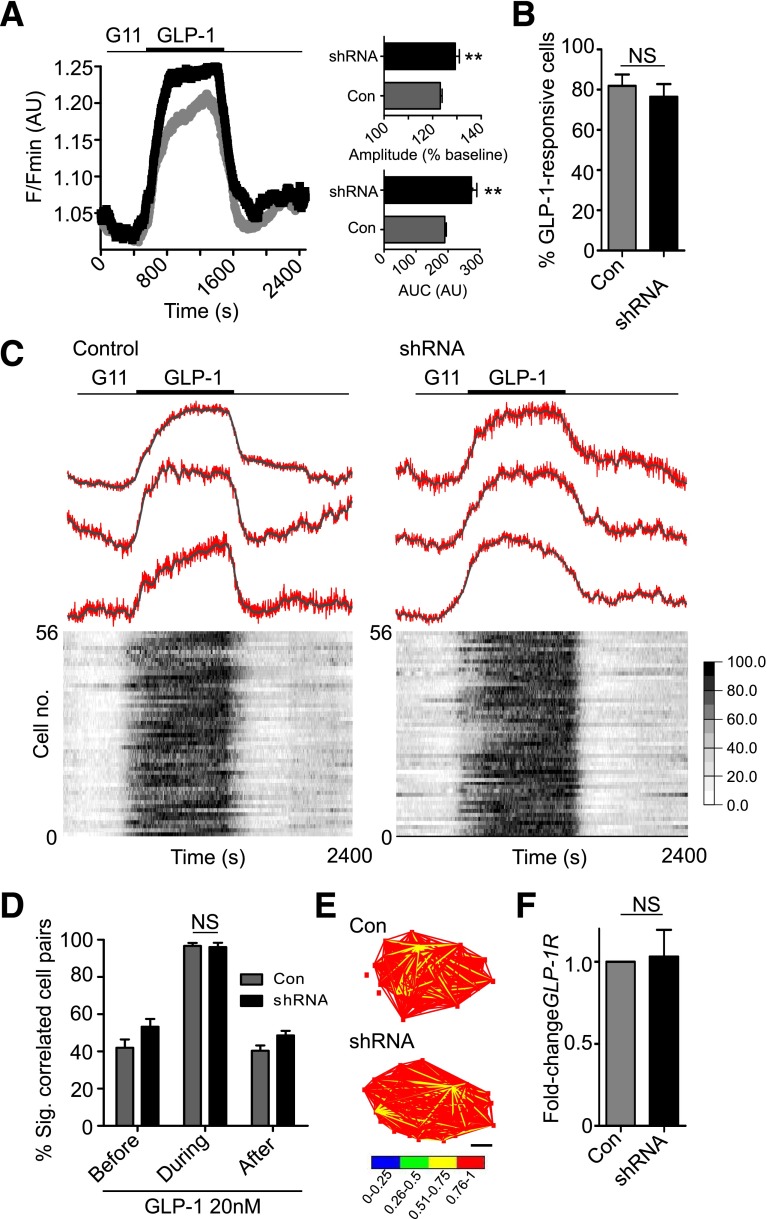
Figure 4.
ADCY5 does not mediate GLP-1–stimulated cytosolic Ca2+ increases. A: ADCY5 knockdown subtly improves GLP-1 responses (left panel: mean traces), as evidenced by increased AUC and amplitude of cytosolic Ca2+ rises in shRNA-treated islets (right panel) (**P < 0.01 vs. Con; Mann-Whitney U test; n = 10 islets from three donors). B: The proportion of GLP-1–responsive cells is similar in Con and shRNA-treated islets (NS, nonsignificant vs. Con; Mann-Whitney U test). C: ADCY5 silencing does not affect coordinated β-cell responses to 11 mmol/L glucose plus GLP-1 (representative Ca2+ traces [top panel]; gray, smoothed; red, raw) (heat map depicting minimum–maximum for each cell [bottom panel]) (n = 10 islets from three donors; correlation measured using 5-min windows). D: Histogram showing mean % significantly correlated cell pairs in Con and shRNA-treated islets before, during, and after GLP-1 application (NS, nonsignificant; two-way ANOVA). E: Representative weighted graphs demonstrating large increases in β-cell connectivity after exposure to GLP-1 in both normal and ADCY5-depleted islets (scale bar, 50 µm). F: Gene silencing does not alter GLP-1R mRNA expression (NS, nonsignificant vs. Con; Student paired t test; n = 3 donors). Values represent mean ± SEM.

