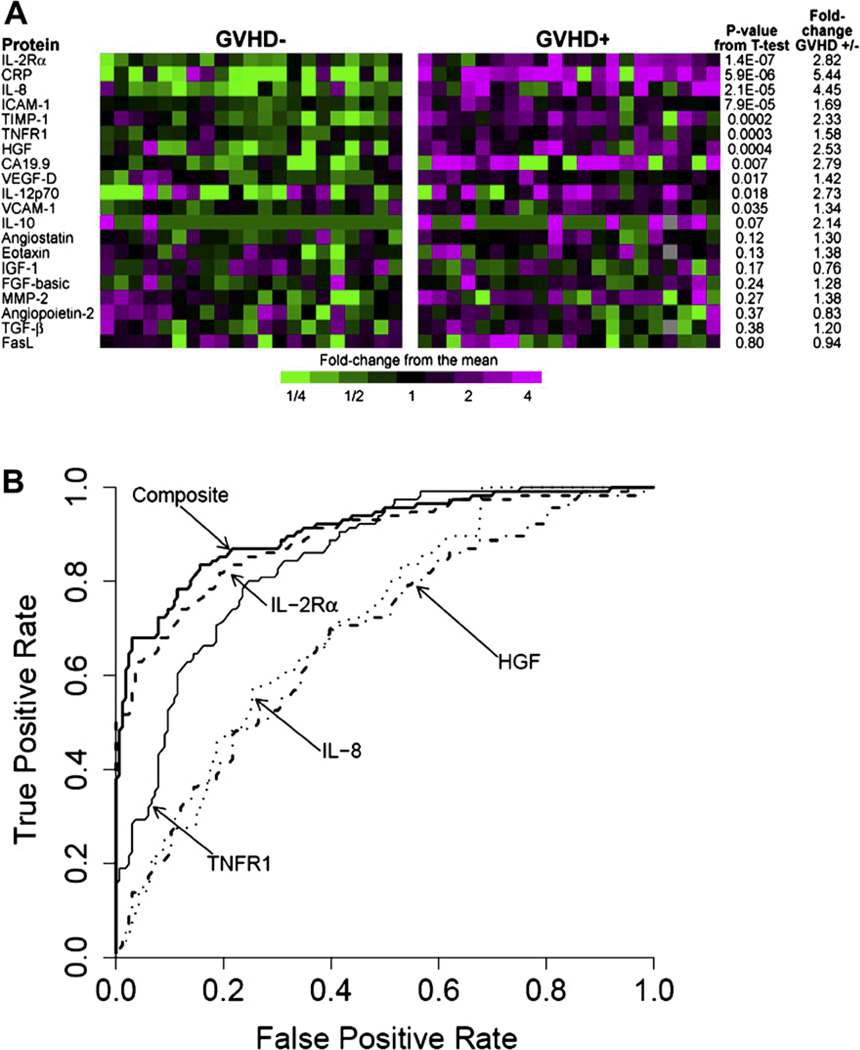
Figure 1. From discovery to validation of plasma biomarkers of acute graft versus host disease.
(This research was originally published in Blood. [115]
Panel A shows the heatmap of proteins levels measured sequential ELISA in the discovery set samples. Samples from 21 GVHD– patients (left) and 21 GVHD+ patients (right) are represented. Eleven proteins gave a P values for differences between GVHD+ and GVHD– patient plasma< 0.05. Panel B shows the receiver operating characteristic (ROC) curves of four individual discriminator proteins and the composite panel in the training set. Individual ROC curves for IL-2Ra,TNFR1, HGF, and IL-8 and the composite panel.

