Figure 3.

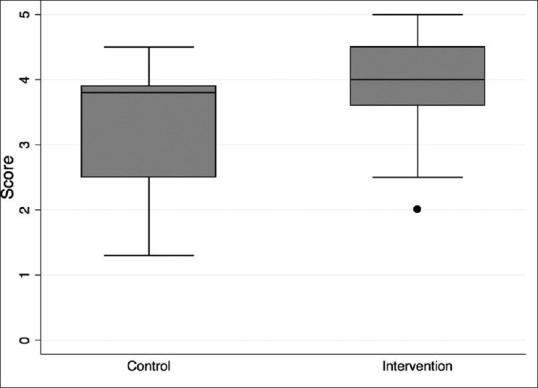
Score distribution between control and intervention groups. The score mean for the control group was 3.33 ± 0.9 versus 3.91 ± 0.7 in the intervention group (F test = 12.1091; P = 0.0008)

Score distribution between control and intervention groups. The score mean for the control group was 3.33 ± 0.9 versus 3.91 ± 0.7 in the intervention group (F test = 12.1091; P = 0.0008)