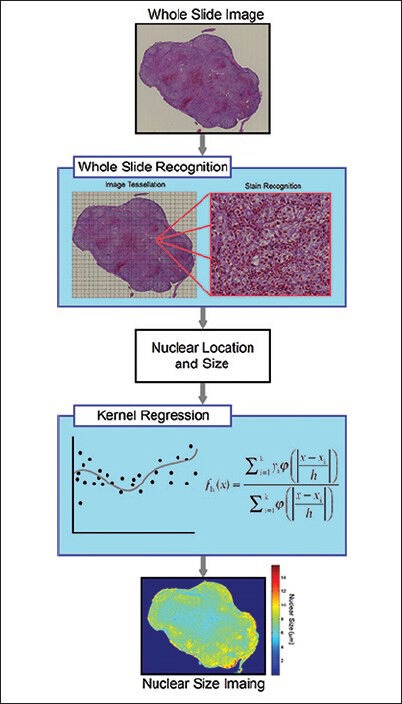
Figure 1.

Flow chart summarizing automatic whole slide image analysis. The whole slide image is first tessellated into several equal-sized blocks padded with an additional margin to avoid double counting. The nuclei in each block are then recognized to obtain their size and location. The size and location information are used in kernel regression analysis to calculate the nuclear size distribution across the entire slide
