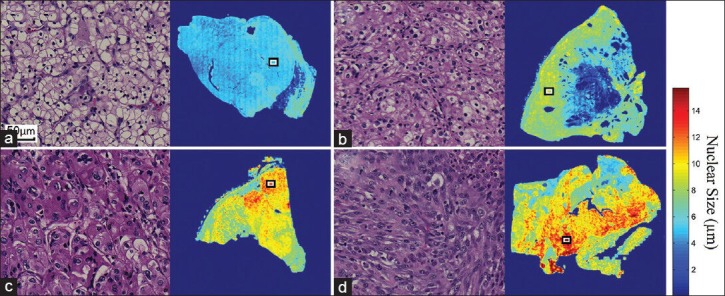
Figure 2.

The spatial distribution of nuclear size calculated from (a) A Grade I, (b) A Grade II,c) A Grade III, and (d) A Grade IV clear cell renal cell carcinoma. The nuclei of these tumors are shown at ×20 magnification (left panels, H&E stain), and their corresponding locations within whole slide imaging slides are annotated by rectangles (right panels). The distribution images provide panoramic views of the quantitative measurement that may assist pathologists in better locating tumor regions of higher grade
