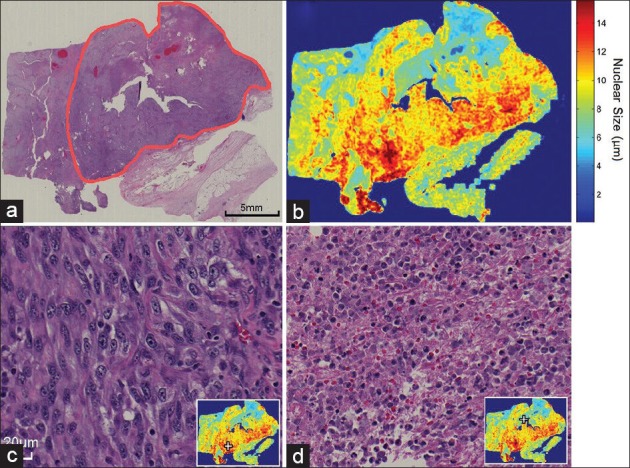
Figure 4.

The spatial distribution of nuclear size can be used as a guide to assist pathologists in locating regions of interest. (a) A low magnification overview of a Grade IV clear cell renal cell carcinoma is annotated using a red contour (H&E stain). (b) The spatial distribution of nuclear size can be used to locate high-grade regions (red) as well as necrosis regions (blue). (c) The high-grade region (located at the + mark) shows tumor cells with enlarged and pleomorphic nuclei and a prominent nucleolus. (d) This necrosis region can also be located at the + mark on the distribution image (inset)
