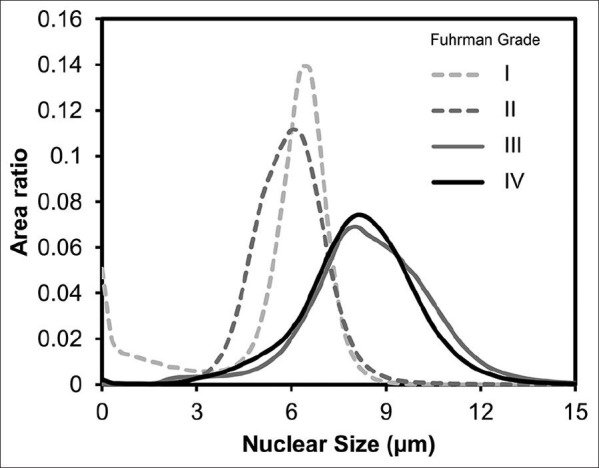
Figure 5.

Distribution of area ratio with respect to nuclear size in different tumor grades. The distribution of Grades III and IV tumors shows substantial shift-to-the-right, whereas the distributions of Grades I and II tumors are centered on a nuclear size of 6 μm. This distribution supports a two-tiered grading scheme
