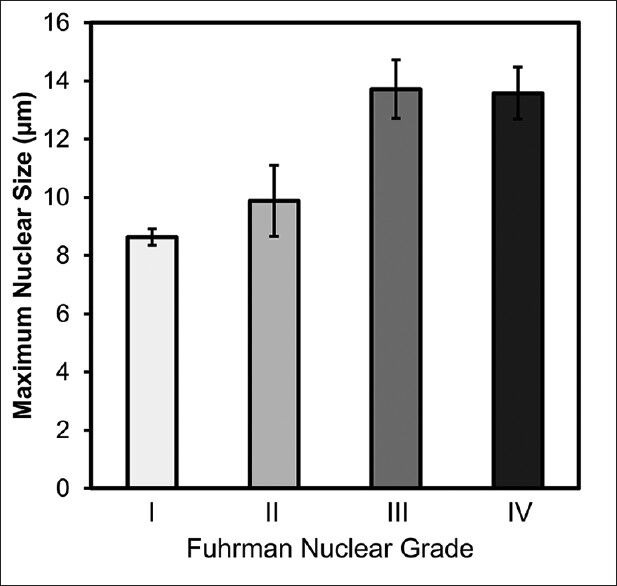
Figure 6.

Maximum nuclear size of tumors determined using image analysis compared with manual Fuhrman nuclear grades. The maximum nuclear size presents an increasing trend in Grades I, II, and III/IV. One-way analysis of variance supports a significant group difference (P < 0.001). Posthoc analysis shows significant differences between Grades I and III, I and IV, II and III, as well as II and IV
