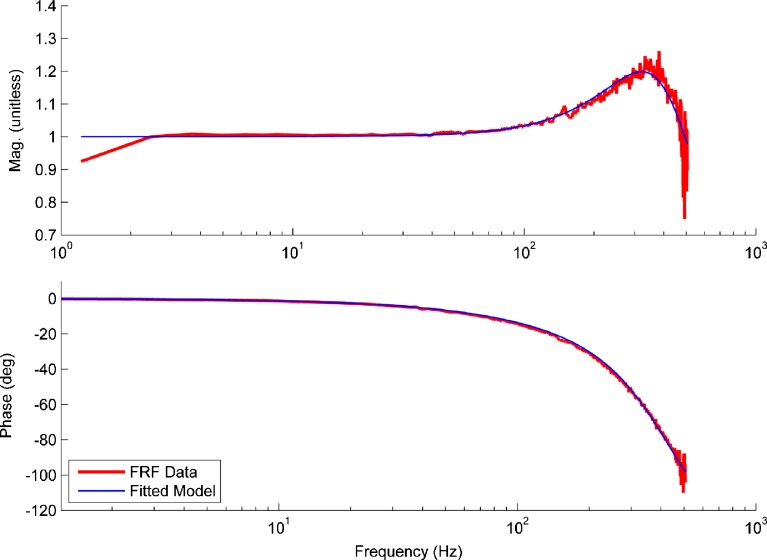
FIG. 4.
Plot showing the fit of the model H MDL (blue line) to the H FRF data (shown in red). This example is that of the median of all NRMSE values and is thus a median representative of the model fit to data. The image registration waveforms of the MF and OL data are used to form the H FRF data. Both magnitude and phase were used in the fitting process of model to data. The magnitude data has been normalized to the mean of the flat response region. The magnitude begins to increase from a flat response close to 100 Hz, and the phase begins to lag as well at this point. Only a single resonance is present in the H FRF data and is indicated by the crest of the magnitude data near 370 Hz. The ω n and ζ are estimated from the H MDL model coefficients determined from the data fit.

