FIG. 6.
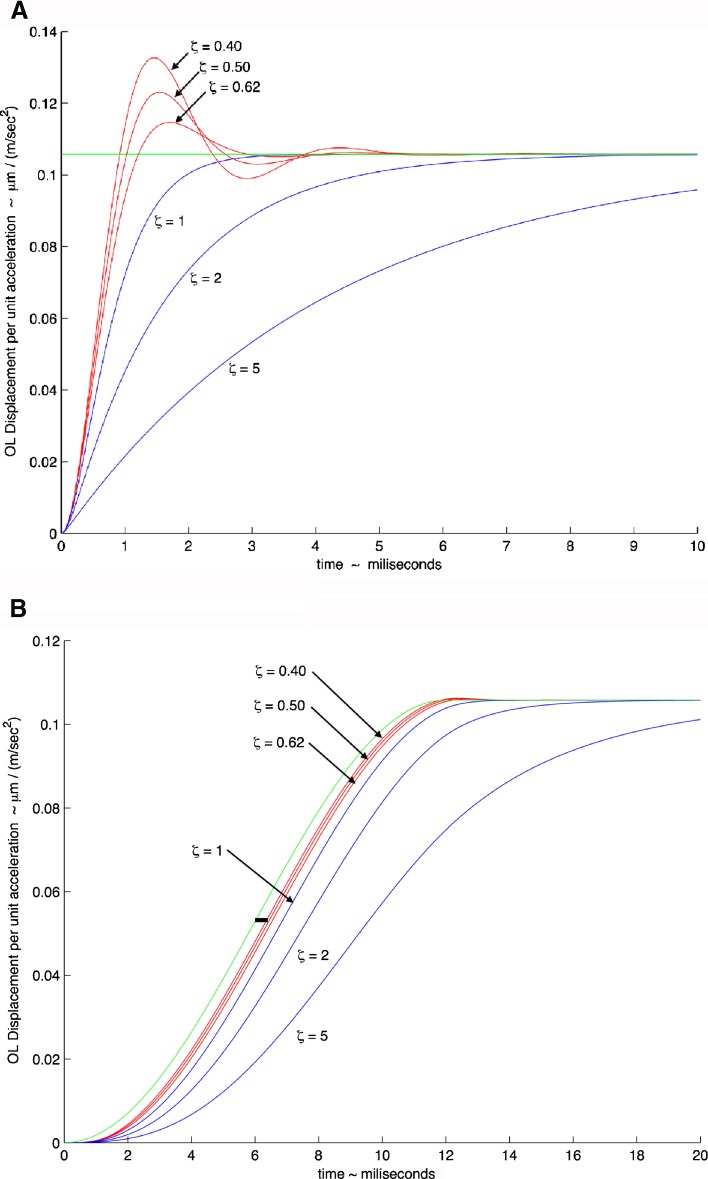
Model response to head acceleration showing mechanical gain of OL displacement per unit acceleration (μm (m · s−2)−1) versus time (ms). A Response to a step change in head acceleration. A step change is commonly used to observe the response dynamics of a second order system. B Model response to head acceleration using a cycloidal increase in acceleration for a 12-ms time period during a feeding strike. The feeding strike that is used for the model response is taken from an actual behavioral study (Rivera et al. 2012) where the cycloidal shape fits a segment of the acceleration experienced during the strike. In both plots, the natural circular frequency of ω n = 374 Hz was used; the two extremes of the damping coefficient are shown, ζ = 0.40 and ζ = 0.62, along with the mean value of ζ = 0.50, are all shown in red. Critically damped value of ζ = 1 and overdamped values of ζ = 2 and ζ = 5 are shown in blue to illustrate the effect of increased damping on time response. The green line illustrates a perfect response of the otolith to the acceleration. The thick horizontal black line shown in (B) and located at a gain of approximately 0.055 and time of 5.5 ms, shows a 0.4-ms time period measured from the perfect response (green) line to the mean value response of ζ = 0.5. This short 0.4 ms time illustrates how rapidly the otolith responds to a real head acceleration stimulus.

