FIG. 7.
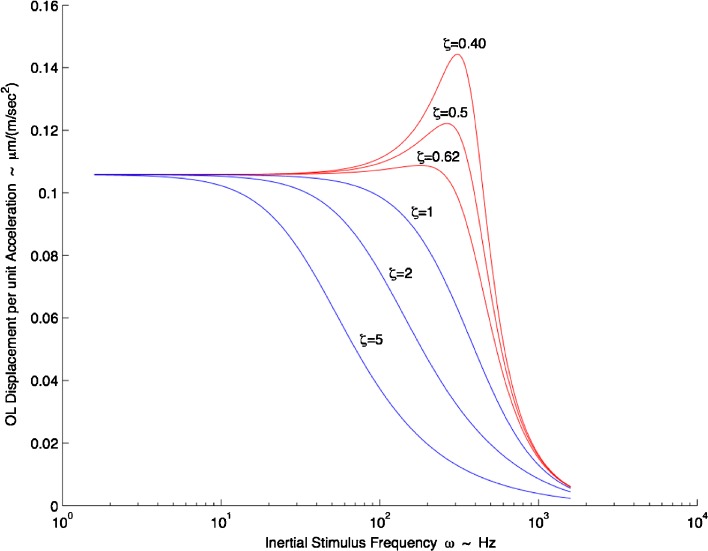
Turtle utricle frequency response. Mechanical gain of displacement per unit acceleration (μm (m · s−2)−1) versus frequency (Hz) is shown. Where ω n = 374 Hz was used; the two extremes of the damping coefficient are shown, ζ = 0.40 and ζ = 0.62, along with the mean value of ζ = 0.50, all shown in red. All values for the frequency response curve are taken from the M-L direction with high-acceleration stimulus. Critically damped value of ζ = 1, and overdamped values of ζ = 2 and ζ = 5 are also shown in blue to illustrate the effect of increased damping on frequency response and bandwidth. There is nearly flat response up to 100 Hz. The upper frequency range for a turtle head accelerations as seen in behavioral studies ranged from 1 up to 70 Hz (Rivera et al. 2012). It is seen in this frequency plot that dynamic bandwidth of the utricle is decreased drastically by having an overdamped system (ζ >1.0) as is shown by the magnitude roll-off at much lower frequencies.

