
. 2014 Jul-Dec;20(2):83–86. doi: 10.4103/1117-6806.137308
Copyright: © Nigerian Journal of Surgery
This is an open-access article distributed under the terms of the Creative Commons Attribution-Noncommercial-Share Alike 3.0 Unported, which permits unrestricted use, distribution, and reproduction in any medium, provided the original work is properly cited.
Graph 1.
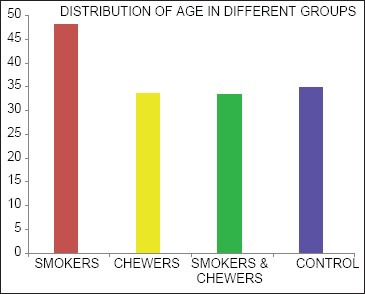
Age distribution in different groups