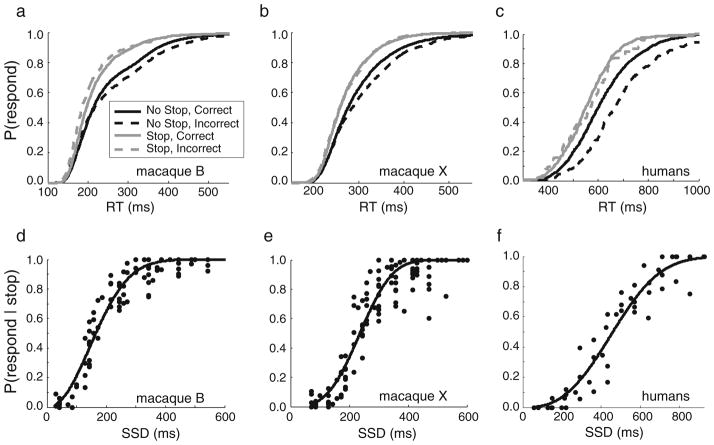
Fig. 3.
Response inhibition performance. (a–c) Grand normalized cumulative distribution functions for response times (RTs) during no-stop (black) and noncanceled stop (gray) trials, for correct (solid lines) and incorrect (dashed lines) choices for (a) macaque B, (b) macaque X, and (c) humans. (d–f) Grand inhibition functions, plotted as the probability of responding during stop trials as a function of stop signal delay (SSD). Each data point is the p(respond) at a given SSD from one session. The data were collapsed across signal strength levels and sessions and were fit with Weibull functions

