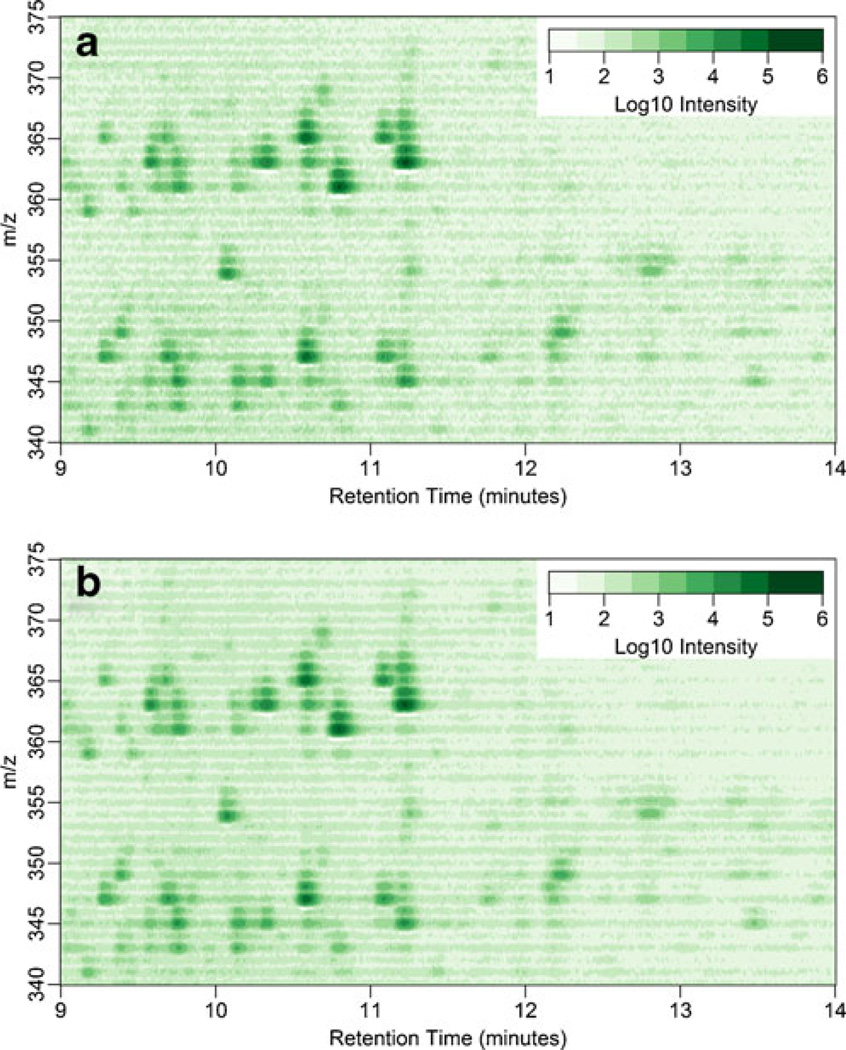
Figure 1.
Pseudocolor plots of mass spectral profile intensities of extracted urine from a Cushing’s disease patient. The plots include the m/z values 340–375 and RT of 9–14 min. Plots are of (a) the intensity of a single replicate and (b) the arithmetic mean intensity of technical triplicates of the same extract

