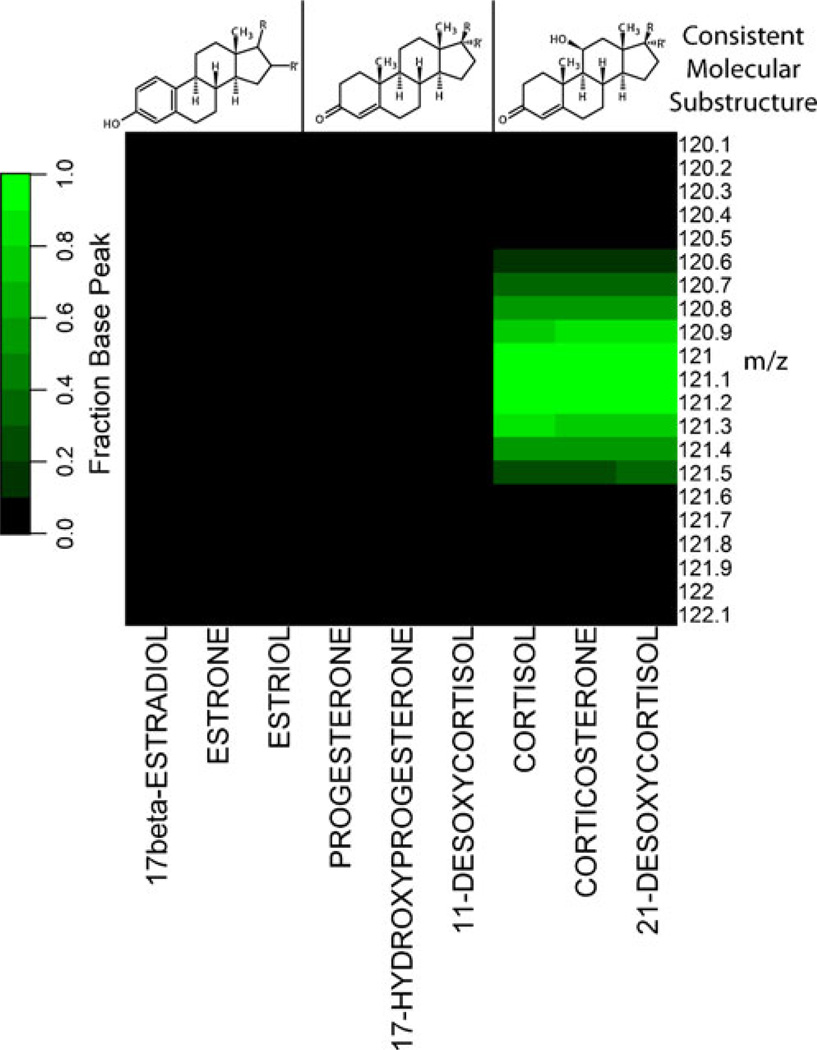
Figure 5.
Evaluation of the product ion intensity as it relates to steroidal molecular substructure. The values are base peak normalized intensities of product ion spectra at CE=40 eV of pure standards. Green values are those m/z values of the product ion spectra that are ≥10 % of the base peak of the product ion spectrum of an analyte. Note that only those analytes that have the A, B, and C ring substructure of Cortisol produce a significant product ion at m/z= 121.1 at this collision energy

