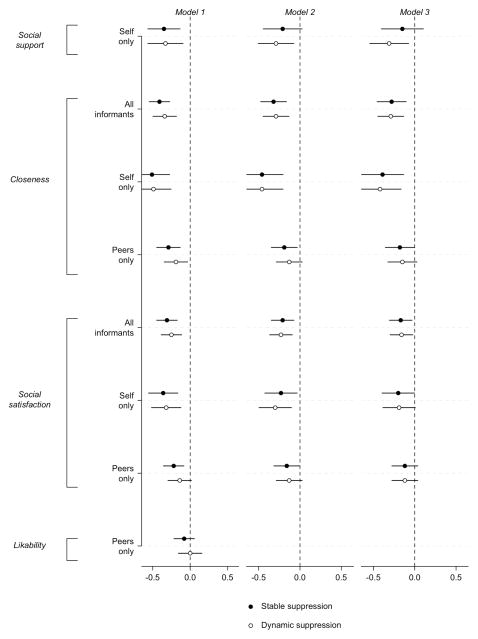
Figure 3.
Effects of antecedent stable and dynamic suppression on end-of-term self- and peer-reports. Dependent variables and data sources are listed along the vertical axis. Dots represent the coefficient estimates and line segments represent 95% confidence intervals; coefficients whose intervals do not cross 0 are therefore significant at p < .05. Model 1 included the stable and dynamic suppression variables. Model 2 included all Model-1 effects plus a control for baseline social functioning. Model 3 included all Model-2 effects plus controls for social activity and positive and negative emotion. Graphing technique adapted from Kastellac and Leoni (2007). Numerical values available from the authors upon request.

