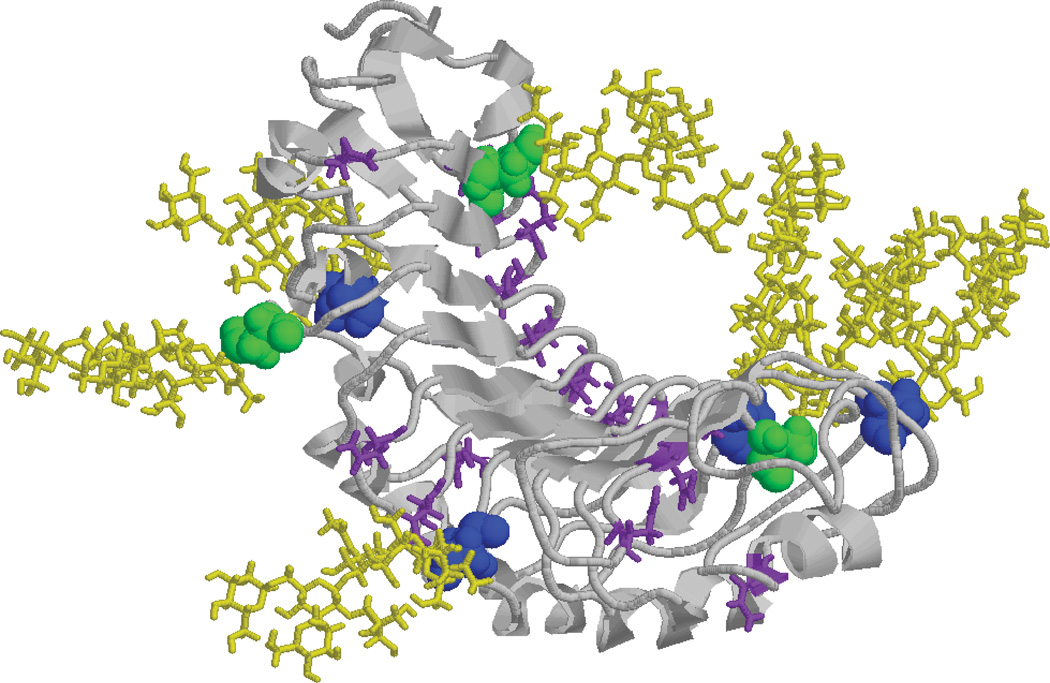
Figure 4.
Homology Model of N-glycosylated PGIP. PNGaseA-only sensitive sites are shown in blue with M3XN2F attached in yellow and PNGAseF and A sensitive sites are shown in green with M3XN2 attached in yellow. The peptide backbone is shown in grey with all unmodified Asn residues labeled in purple.

