
Fig. 6.
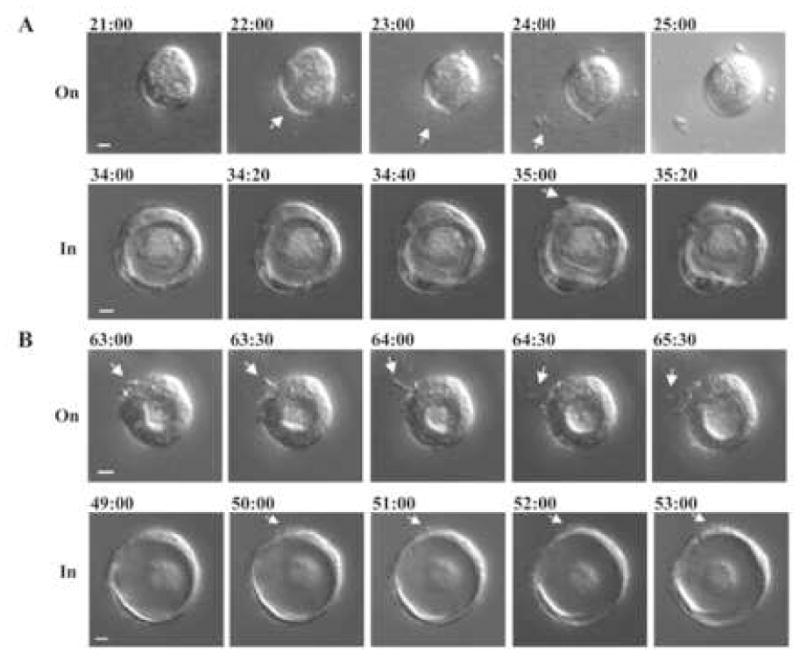
Live-cell imaging of MDCK cystogenesis. MDCK cells were cultured either on or in Matrigel. DIC images were captured using time-lapse video microscopy in constant time intervals as indicated. The pictures display an X-Y focal plane that traverses the cyst. The number on the top of each image denotes the time (h:min) from the onset of time-lapse video microscopy, i.e.,1 day after plating cells on or 2 days after plating in Matrigel. (A) Arrows indicate the cellular structures that were released before or after a cyst was formed on Matrigel. (B) Arrows indicate the cellular structures that protruded from the cyst after a cyst was formed. Bars: 10 μm.